Fig. 12.
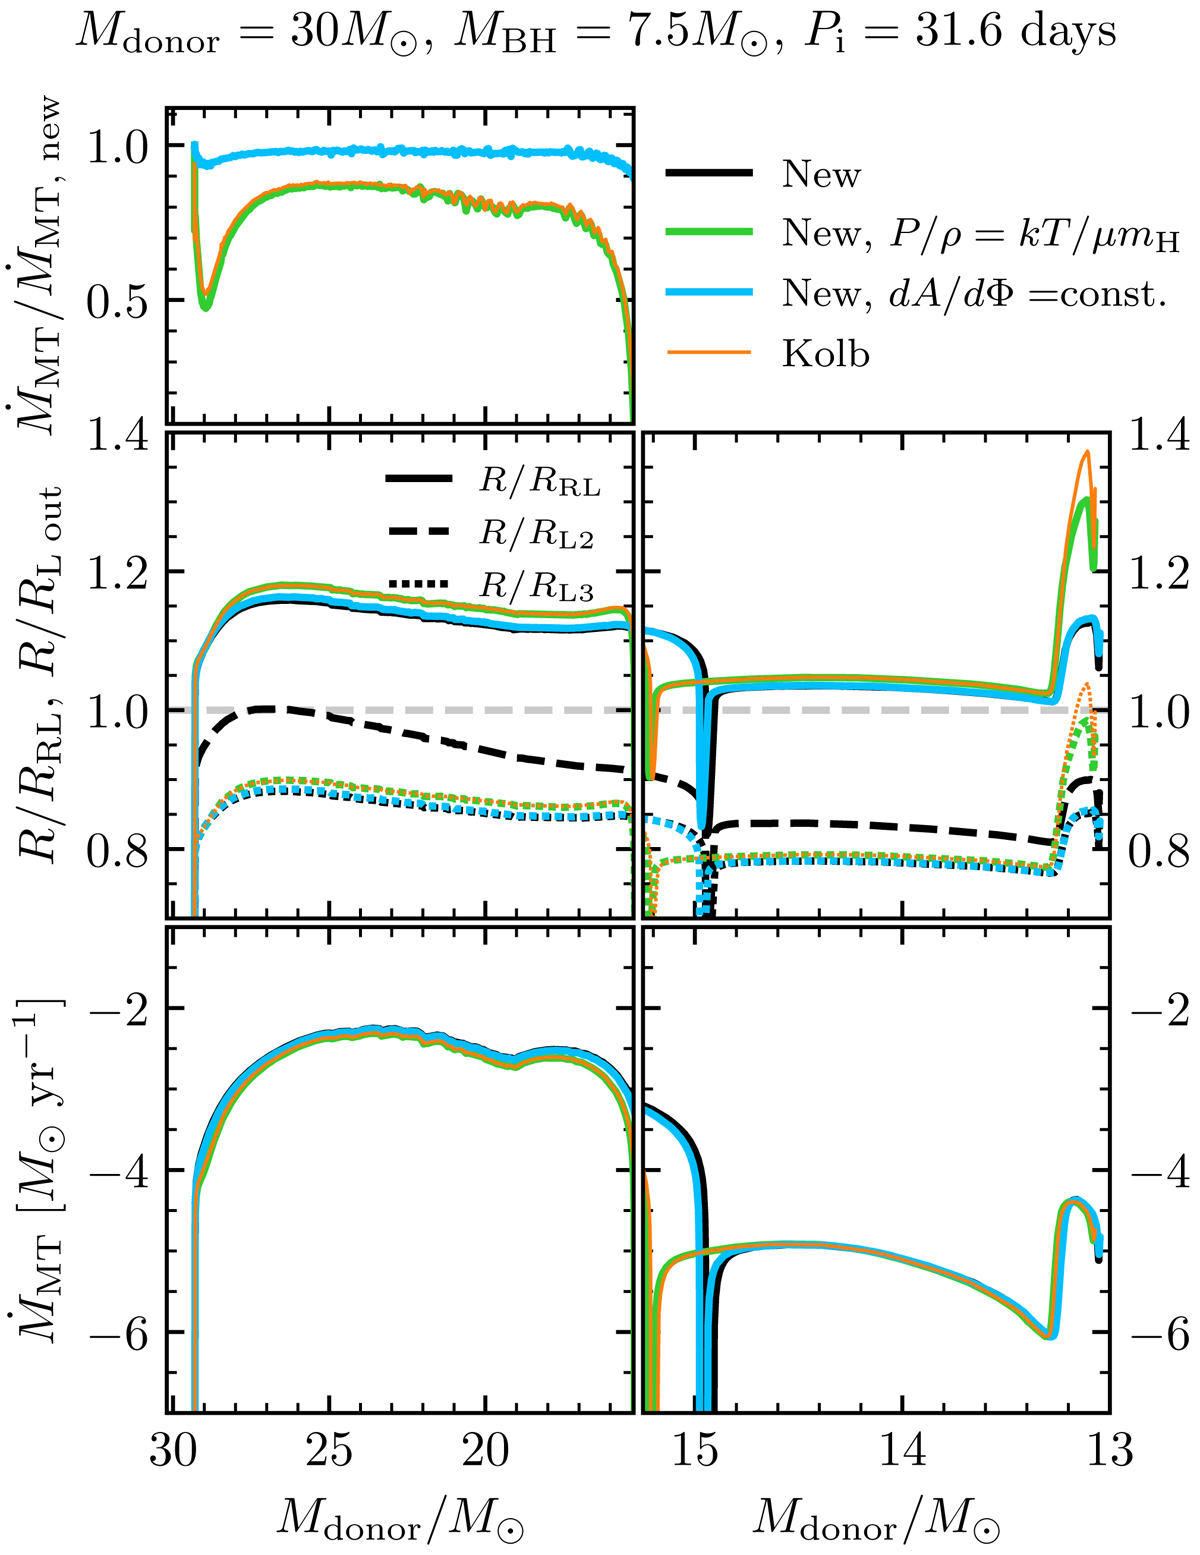
Evolution of the MT rate and overflow for a system with a 30 M⊙ donor star, a 7.5 M⊙ BH, and an initial orbital period of 31.6 days. Top: ratio of the computed MT rate under different assumptions, compared to the result from our full MT prescription. Middle: ratio of the stellar radius to the Roche lobe radius and to the volume equivalent radius of the L2 and L3 equipotentials (for the L2 equipotential, we only include the results of our default model for ease of visualization). Bottom: MT rate.
Current usage metrics show cumulative count of Article Views (full-text article views including HTML views, PDF and ePub downloads, according to the available data) and Abstracts Views on Vision4Press platform.
Data correspond to usage on the plateform after 2015. The current usage metrics is available 48-96 hours after online publication and is updated daily on week days.
Initial download of the metrics may take a while.