Fig. 5.
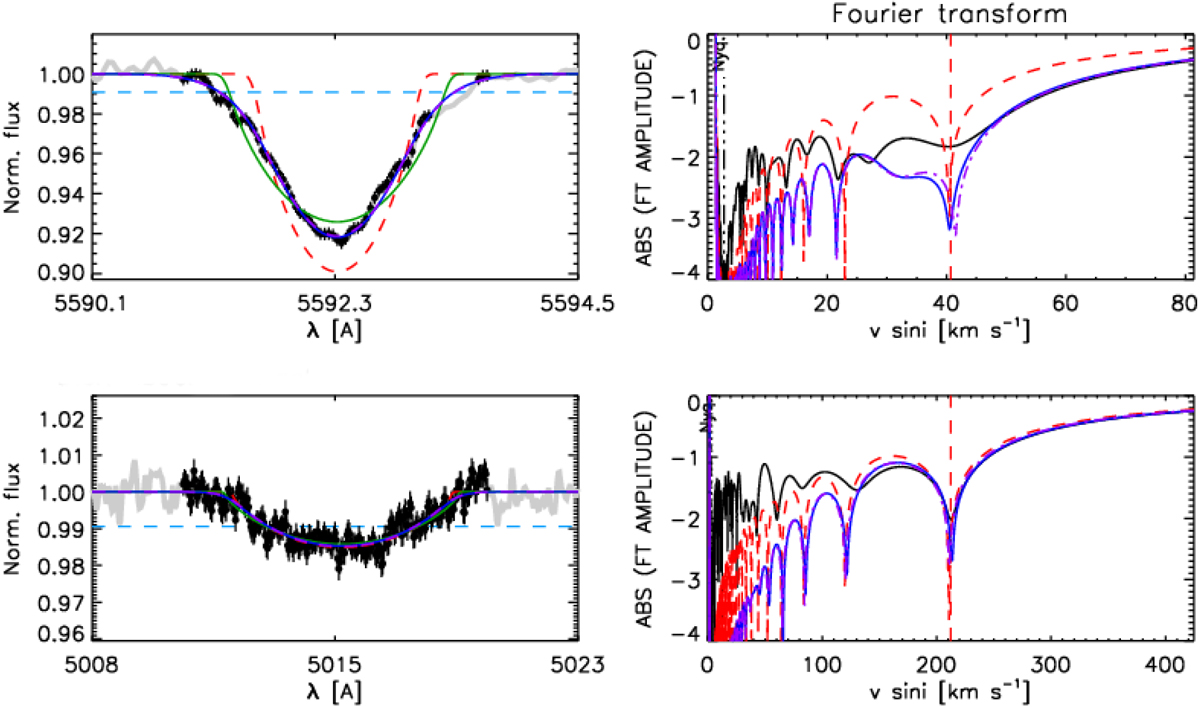
Graphical output of the IACOB-BROAD tool for both stellar components of HD 96264A. The left upper panel shows the line profile of O IIIλ5592 of the primary component and the right upper panel shows its Fourier transform. The bottom panels show similar plots for the He Iλ5015 line of the secondary component. Four fits are presented in each case: v sin i(FT) in red, (v sin i, vmac) (GOF) in blue, (v sin i, vmac = 0.0) (GOF) in green, and (v sin i = FT, vmac) (GOF) in violet.
Current usage metrics show cumulative count of Article Views (full-text article views including HTML views, PDF and ePub downloads, according to the available data) and Abstracts Views on Vision4Press platform.
Data correspond to usage on the plateform after 2015. The current usage metrics is available 48-96 hours after online publication and is updated daily on week days.
Initial download of the metrics may take a while.