Fig. 5
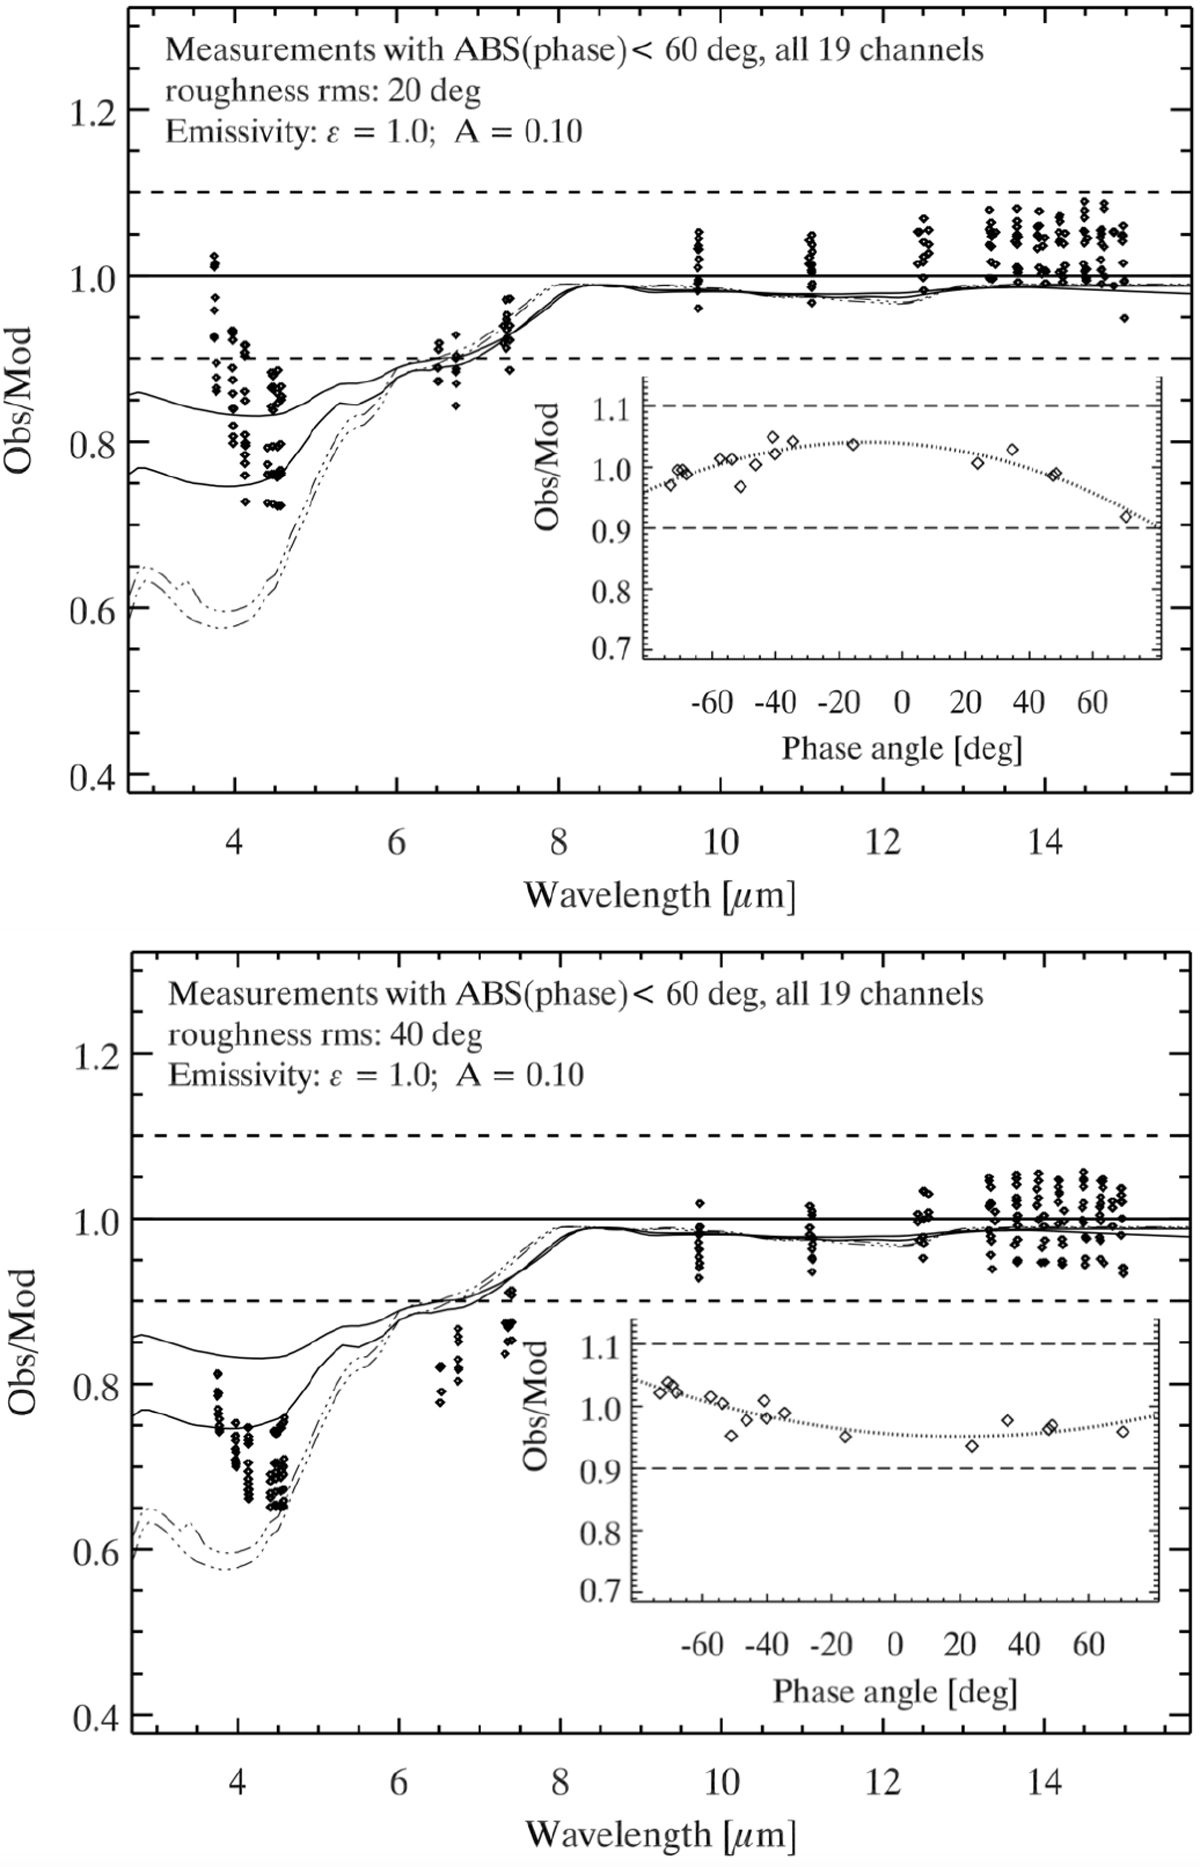
Observations divided by TPM predictions (ϵ = 1.0; albedo A = 0.10) as a function of wavelengths (and for channel 08 at 11.1 μm also as a function of phase angle in the inserted figures). The measurements are shown as diamond symbols, the scatter within each channel or wavelength is associated to a small but systematic deviation dependent on phase angle. The ECOSTRESS emissivity (calculated as 1-reflectance) spectra for two extreme maria samples (solid lines) and two extreme highland samples (dotted-dashed lines) are shown. All other (maria, transition & highland) samples would fall between these lines. Top: for a low surface roughness (rms 20°). Bottom: using a high roughness (rms 40°) in the TPM. The dotted lines in the phase angle plots are second order fits through the ratios.
Current usage metrics show cumulative count of Article Views (full-text article views including HTML views, PDF and ePub downloads, according to the available data) and Abstracts Views on Vision4Press platform.
Data correspond to usage on the plateform after 2015. The current usage metrics is available 48-96 hours after online publication and is updated daily on week days.
Initial download of the metrics may take a while.