Fig. 9.
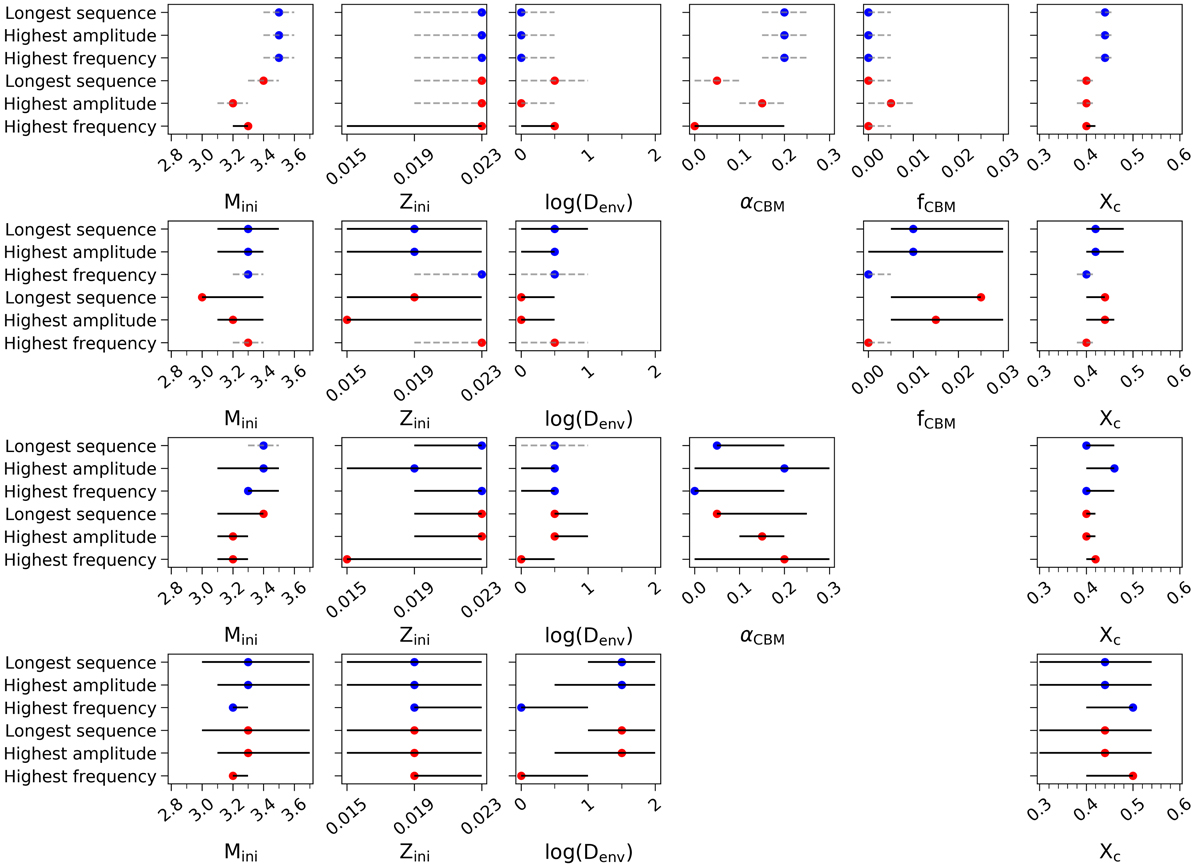
Parameters of the selected best model with their uncertainty ranges indicated by the black lines. If no uncertainty was found through Bayes’ theorem, its upper limit is indicated by the dashed grey lines. The blue and red symbols indicate the results for the radiative and Péclet grid, respectively, while the labels on the y-axis indicate how the theoretical frequency pattern was constructed. The top row of figures represents the full grids, while the rows underneath represent the nested grids with fewer parameters.
Current usage metrics show cumulative count of Article Views (full-text article views including HTML views, PDF and ePub downloads, according to the available data) and Abstracts Views on Vision4Press platform.
Data correspond to usage on the plateform after 2015. The current usage metrics is available 48-96 hours after online publication and is updated daily on week days.
Initial download of the metrics may take a while.