Fig. 8.
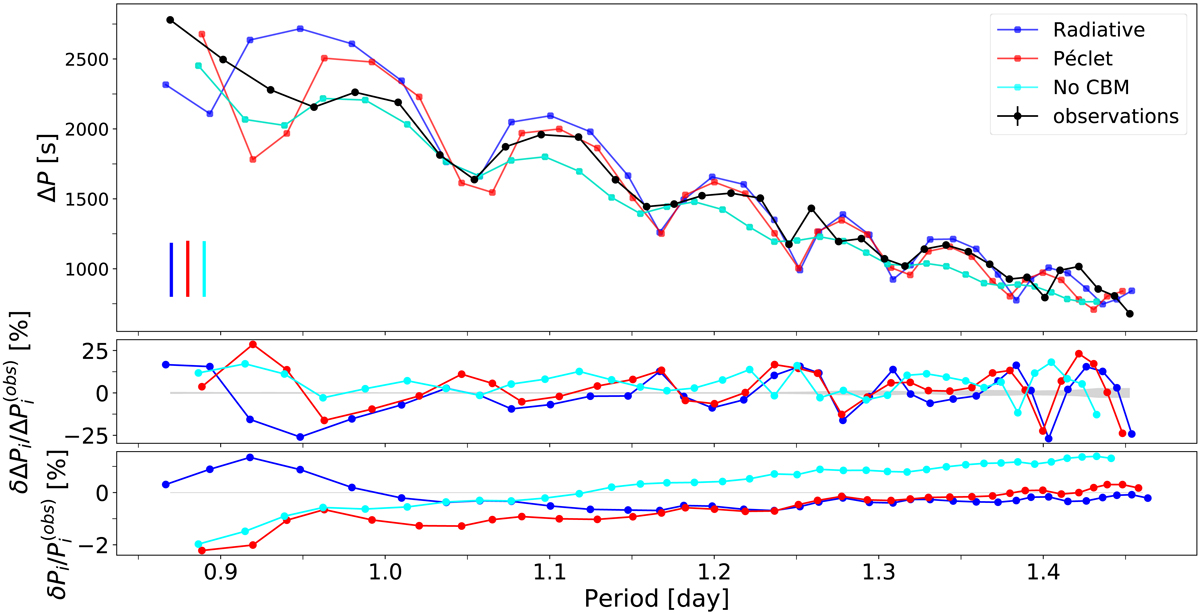
Period spacing patterns of the observations, of the best models of the two grids, and of the nested grid where no CBM is included in the models, as extracted by the longest sequence method. The formal errors on the observations are smaller than the symbol sizes. The vertical bars in the bottom left corner show the maximum considered uncertainty for the theoretical predictions approximated by the variance–covariance matrix of that particular grid. Middle and bottom panels: relative difference in period spacing and period, respectively, between the observation and the model. The narrow grey areas indicate the formal 1σ observational uncertainty from Pápics et al. (2015), including the correction factor of four.
Current usage metrics show cumulative count of Article Views (full-text article views including HTML views, PDF and ePub downloads, according to the available data) and Abstracts Views on Vision4Press platform.
Data correspond to usage on the plateform after 2015. The current usage metrics is available 48-96 hours after online publication and is updated daily on week days.
Initial download of the metrics may take a while.