Fig. 9.
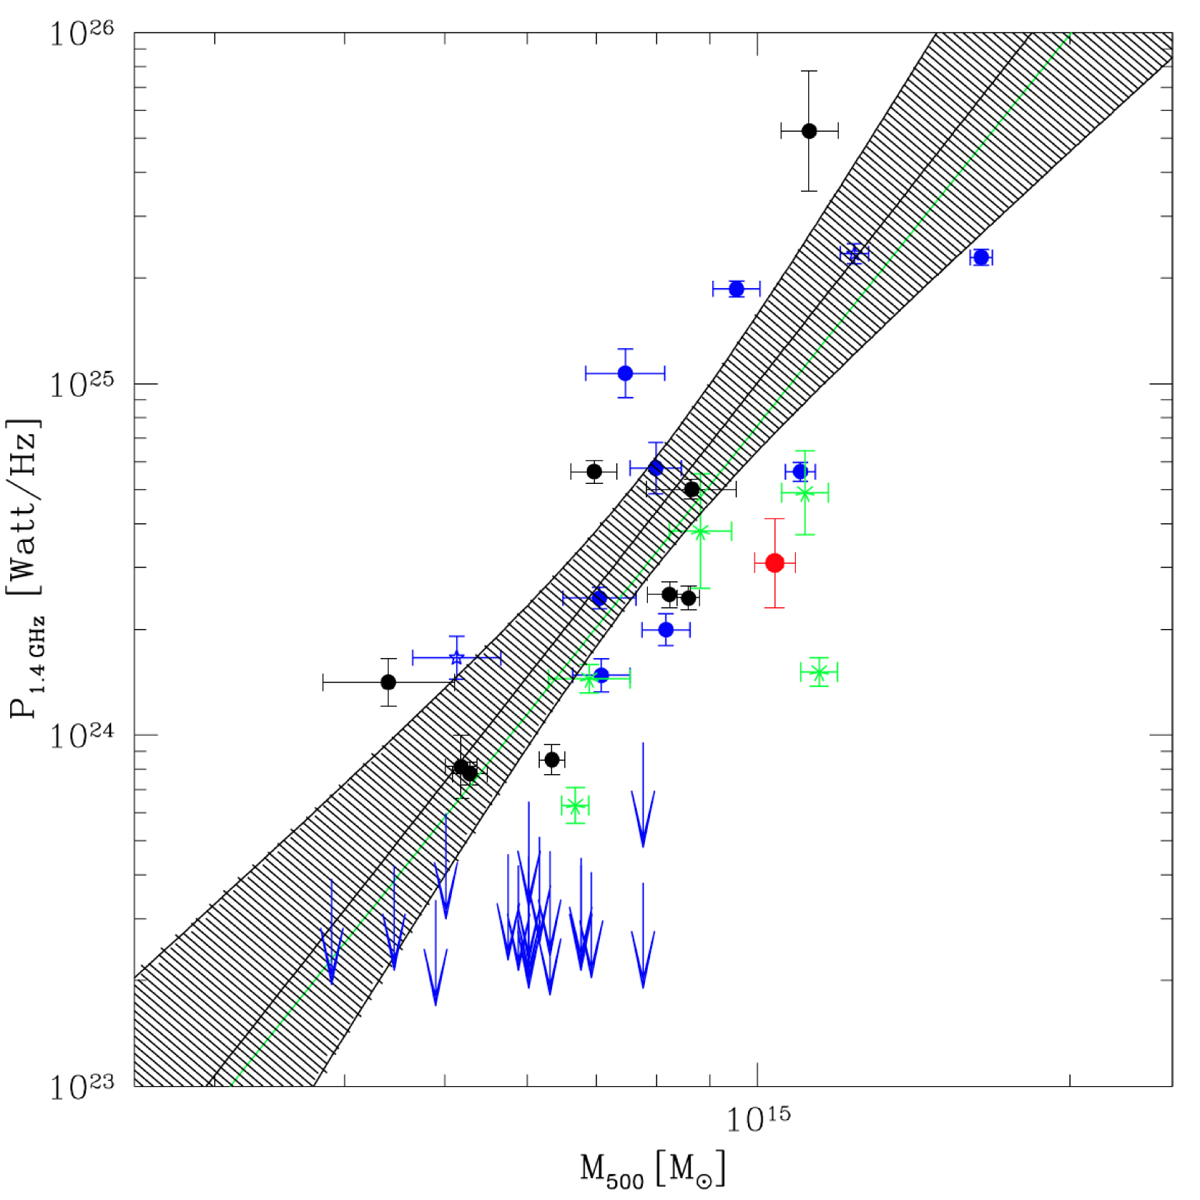
Distribution of galaxy clusters in the P1400 − M500 plane (adapted from Cassano et al. 2013, see it for details of the legend). MACS J1149 (red dot) has M500 = (10.4 ± 0.5)×1014 M⊙ and P1400 = (3.1 ± 0.9)×1024 W Hz−1; it is under-luminous with respect to the correlation by a factor of ∼3 and is located among the steep spectrum radio halos (green dots).
Current usage metrics show cumulative count of Article Views (full-text article views including HTML views, PDF and ePub downloads, according to the available data) and Abstracts Views on Vision4Press platform.
Data correspond to usage on the plateform after 2015. The current usage metrics is available 48-96 hours after online publication and is updated daily on week days.
Initial download of the metrics may take a while.