Fig. 6.
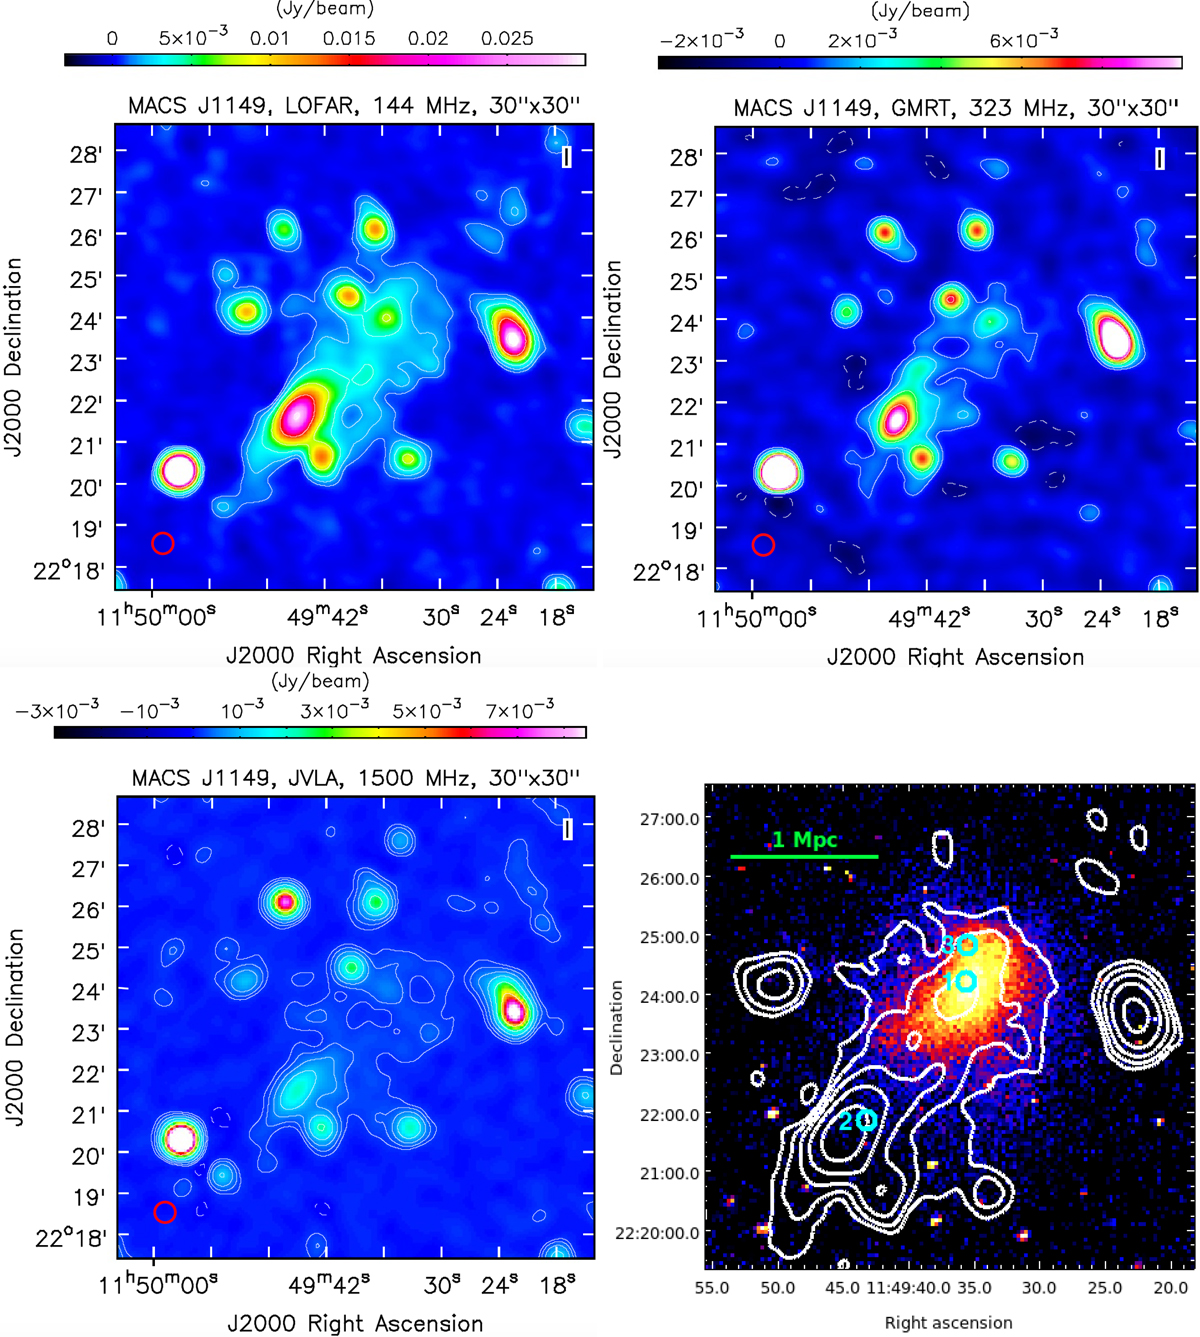
MACS J1149 radio maps at 30″ × 30″ resolution. In all the panels, the contour levels are [ ± 3, 6, 12, …]×σ. Top left: 144 MHz LOFAR map (σ ∼ 0.30 mJy beam−1). Top right: 323 MHz GMRT map (σ ∼ 0.30 mJy beam−1). Bottom left: 1.5 GHz JVLA (D array) map (σ ∼ 45 μJy beam−1). Bottom right: 144 MHz LOFAR contours (after the subtraction of the embedded sources) overlaid on the X-ray image of Fig. 1.
Current usage metrics show cumulative count of Article Views (full-text article views including HTML views, PDF and ePub downloads, according to the available data) and Abstracts Views on Vision4Press platform.
Data correspond to usage on the plateform after 2015. The current usage metrics is available 48-96 hours after online publication and is updated daily on week days.
Initial download of the metrics may take a while.