Fig. 5.
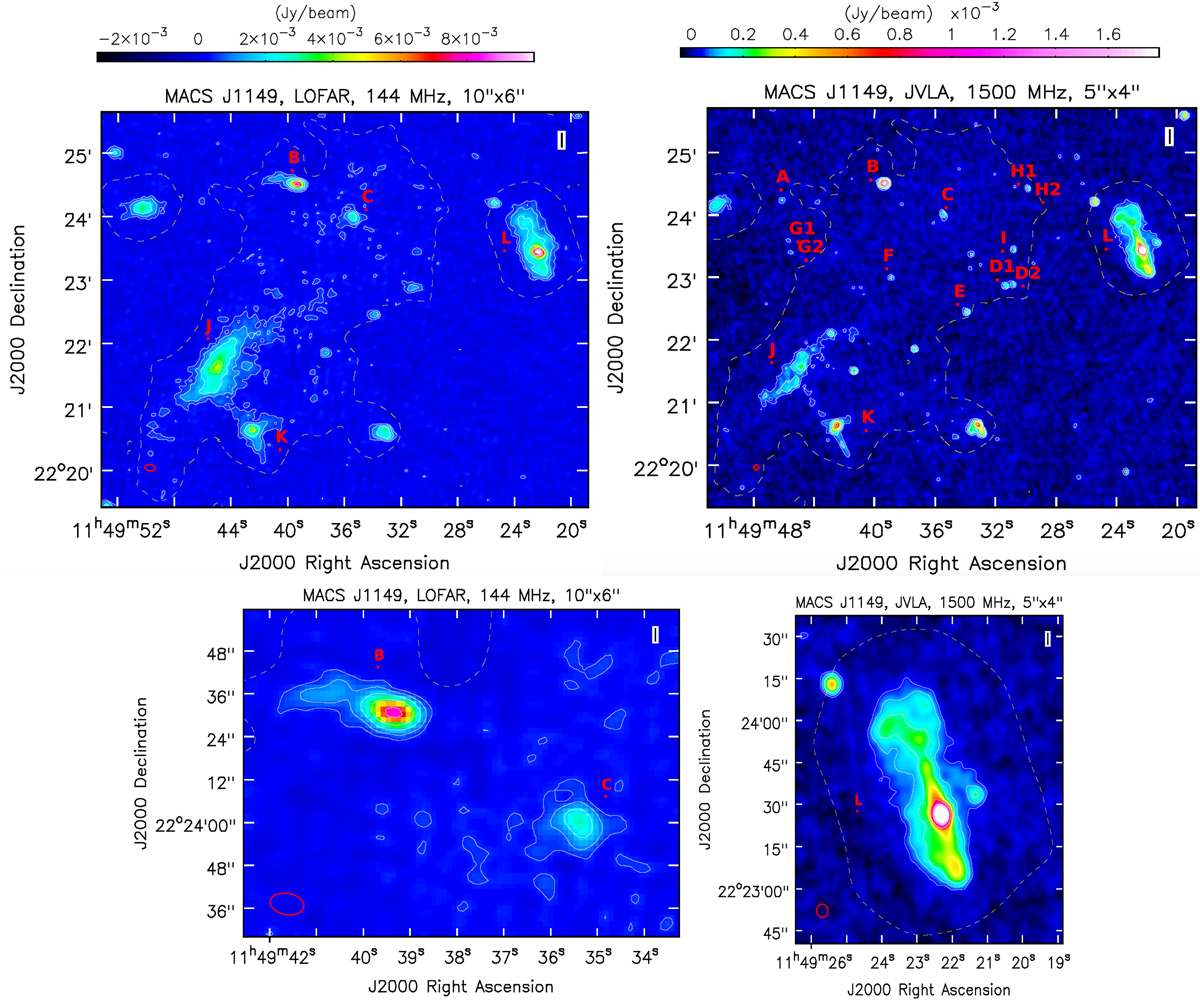
MACS J1149 radio maps at high resolution. In all the panels, the white contour levels are [ ± 3, 6, 12, …]×σ. The dashed yellow contour indicates the 3σ (with σ ∼ 0.30 mJy beam−1) level of the 30″ × 30″ resolution LOFAR map after the subtraction of the embedded sources (see also Fig. 6). Top left: 144 MHz LOFAR map at 10″ × 6″ resolution (P.A. = 81° , σ ∼ 0.15 mJy beam−1). The western source ‘L’ has recently been reclassified as a radio galaxy. The SE relic is labelled as ‘J’ and a bridge-like structure links it to the source ‘K’. Top right: 1.5 GHz JVLA (B, C, D arrays combined) map at 5″ × 4″ resolution (P.A. = 16o, σ ∼ 18 μJy beam−1) showing the discrete sources embedded in the radio halo. Bottom left: zoom of the above LOFAR image on the two extended sources ‘B’ (head-tail radio galaxy) and ‘C’. Bottom right: zoom of the above JVLA image on the radio galaxy ‘L’ showing its FRI morphology.
Current usage metrics show cumulative count of Article Views (full-text article views including HTML views, PDF and ePub downloads, according to the available data) and Abstracts Views on Vision4Press platform.
Data correspond to usage on the plateform after 2015. The current usage metrics is available 48-96 hours after online publication and is updated daily on week days.
Initial download of the metrics may take a while.