Fig. 4.
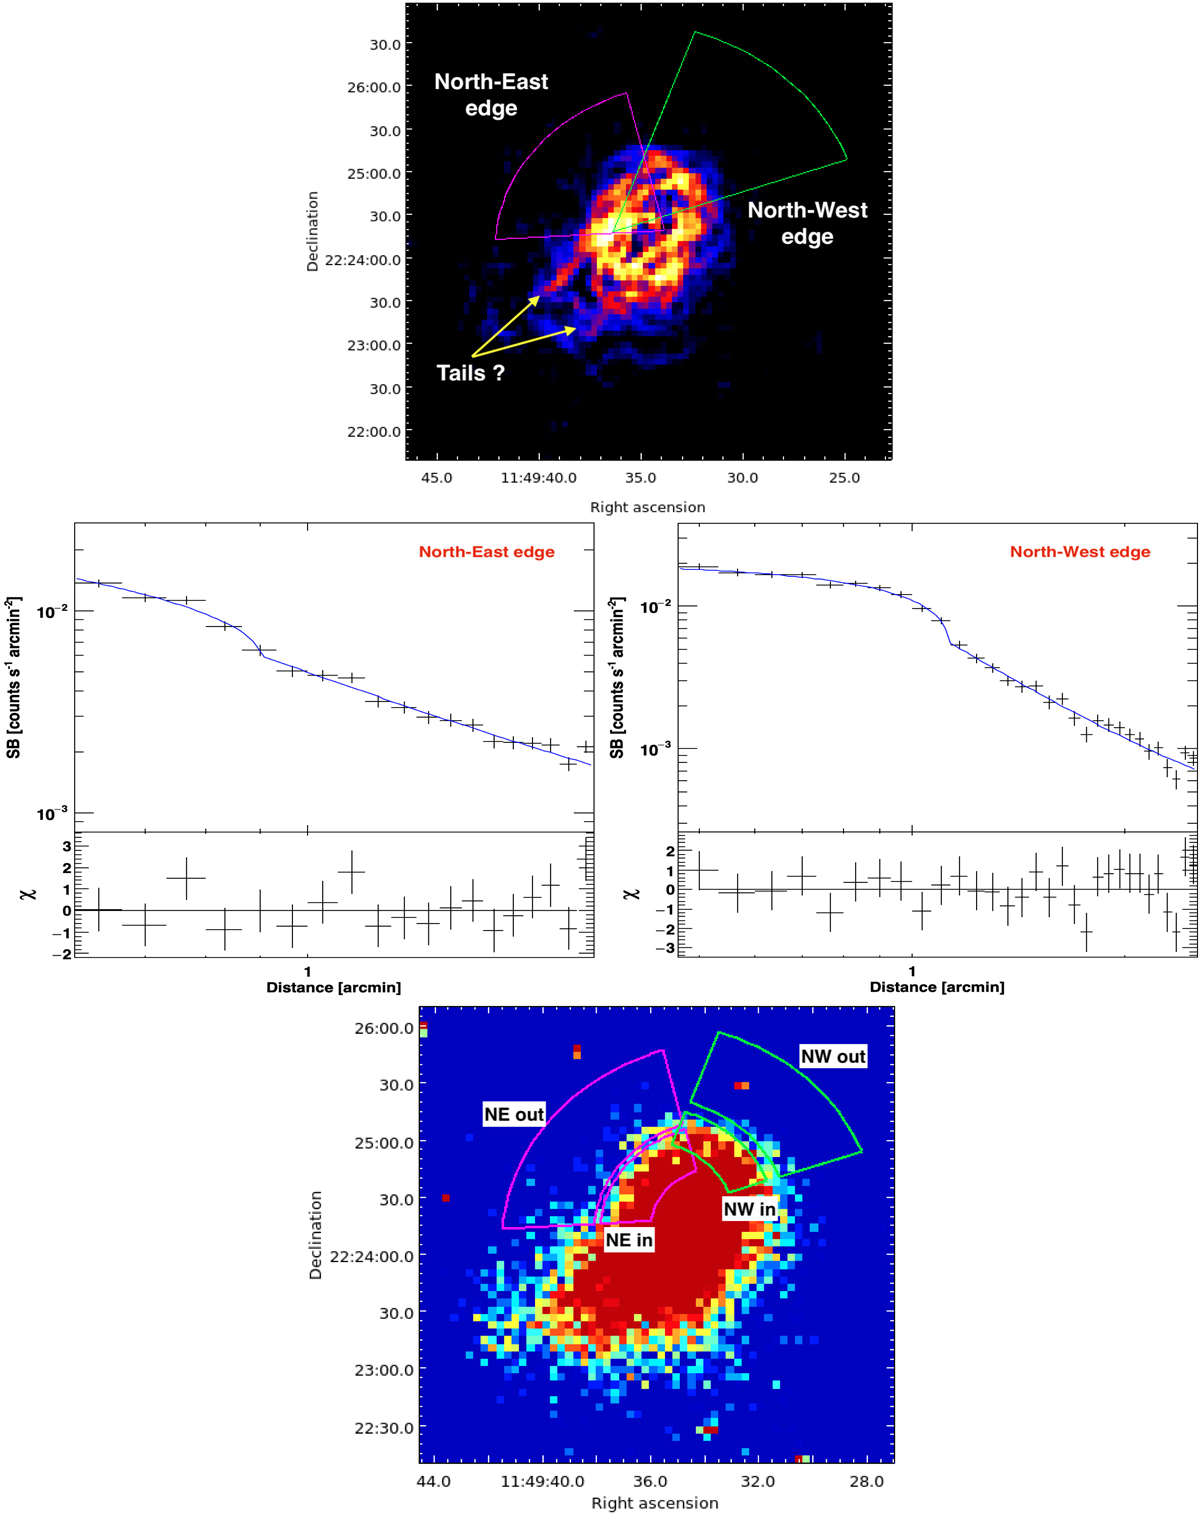
Top: GGM-filtered X-ray image with σGGM = 4″. Two possible surface brightness edges are revealed in the NE and NW. Two filamentary structures (the ‘tails’) are present at south. Middle left: best fit (χ2/d.o.f. = 0.99) of the NE edge with a broken power law. The density compression factor is C = 1.38 ± 0.11. Middle right: best fit (χ2/d.o.f. = 1.12) of the NW edge with a broken power law. The density compression factor is C = 1.52 ± 0.11. A fit with a single power law is rejected (χ2/d.o.f. = 1.80) and thus not shown. Bottom: X-ray count image showing the sectors used to extract the spectra upstream and downstream the surface brightness discontinuities. There are no significant temperature jumps.
Current usage metrics show cumulative count of Article Views (full-text article views including HTML views, PDF and ePub downloads, according to the available data) and Abstracts Views on Vision4Press platform.
Data correspond to usage on the plateform after 2015. The current usage metrics is available 48-96 hours after online publication and is updated daily on week days.
Initial download of the metrics may take a while.