Fig. 2.
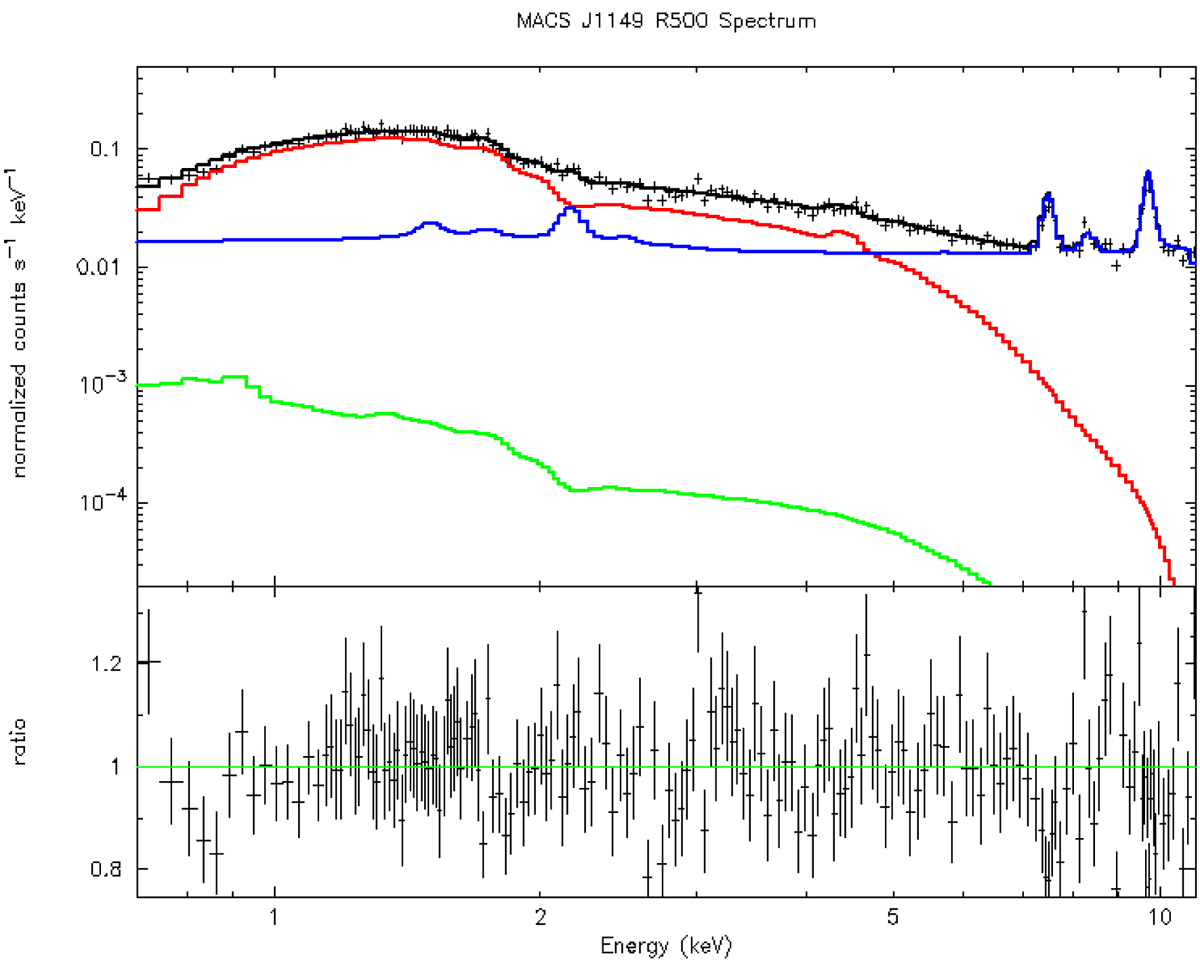
MACS J1149 X-ray spectrum within R500. Data and best-fit model are shown in black. The red, green, and blue curves indicate the cluster emission, the sky background, and the NXB, respectively. The bottom panel shows the ratio of the data to the model. Fits were performed simultaneously for all the observations, but we report only one spectrum for a clearer inspection of the plot; kT = 10.5 ± 0.3 keV and Z = 0.23 ± 0.05 Z⊙ were obtained.
Current usage metrics show cumulative count of Article Views (full-text article views including HTML views, PDF and ePub downloads, according to the available data) and Abstracts Views on Vision4Press platform.
Data correspond to usage on the plateform after 2015. The current usage metrics is available 48-96 hours after online publication and is updated daily on week days.
Initial download of the metrics may take a while.