Fig. 10.
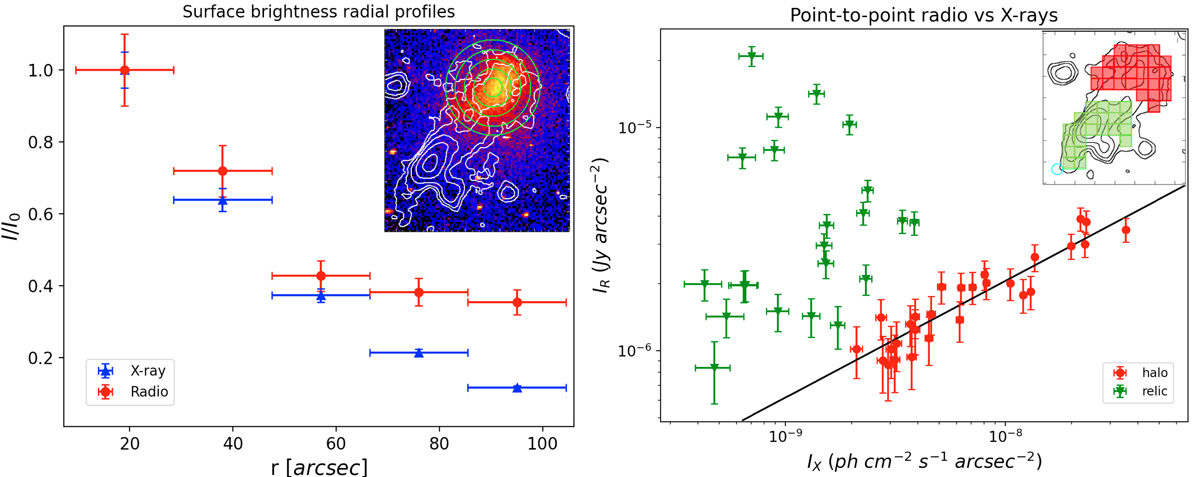
Left: radio (red circles) and X-ray (blue triangles) surface brightness radial profiles within the halo region, normalised at their maximum. The source-subtracted LOFAR map at 19″ × 15″ resolution sampled with concentric annuli of 19″ width is shown in the corner. Right: point-to-point analysis of the IR − IX relation. In the corner, we report the contours of the 30″ × 30″ source-subtracted LOFAR map, gridded with green and red 30″ × 30″ square boxes for the relic and halo, respectively. The halo points present a sub-linear correlation with a slope in the range [0.42–0.60]. The black line represents the best fit obtained with the BCES-orthogonal method at 3σ threshold.
Current usage metrics show cumulative count of Article Views (full-text article views including HTML views, PDF and ePub downloads, according to the available data) and Abstracts Views on Vision4Press platform.
Data correspond to usage on the plateform after 2015. The current usage metrics is available 48-96 hours after online publication and is updated daily on week days.
Initial download of the metrics may take a while.