Fig. 1.
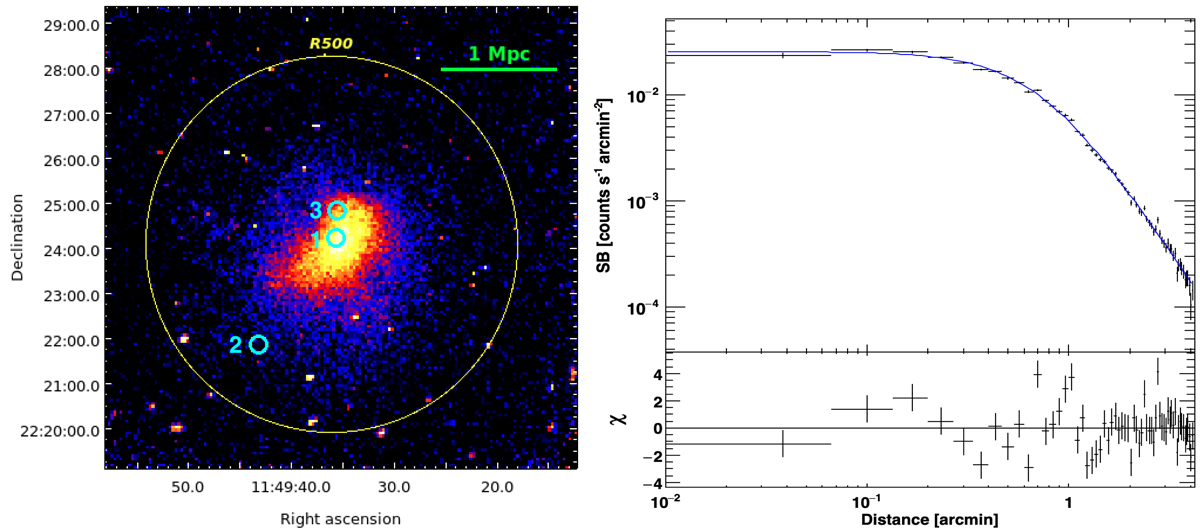
Left: MACS J1149 X-ray map obtained with Chandra in the 0.5–3 keV band (1 pix = 4″). The region within R500 is indicated in yellow and cyan circles label the location of the three sub-clusters, as reported by Golovich et al. (2016). The cluster is elongated along NW-SE. Sub-cluster 1 is associated with the main X-ray concentration, whereas no clumps associated with sub-cluster 2 are clearly visible. Right: X-ray surface brightness profile. Data are fitted by a β-model (blue line) with β = 0.66 ± 0.01 and rc = 288 ± 8 kpc.
Current usage metrics show cumulative count of Article Views (full-text article views including HTML views, PDF and ePub downloads, according to the available data) and Abstracts Views on Vision4Press platform.
Data correspond to usage on the plateform after 2015. The current usage metrics is available 48-96 hours after online publication and is updated daily on week days.
Initial download of the metrics may take a while.