Fig. 2.
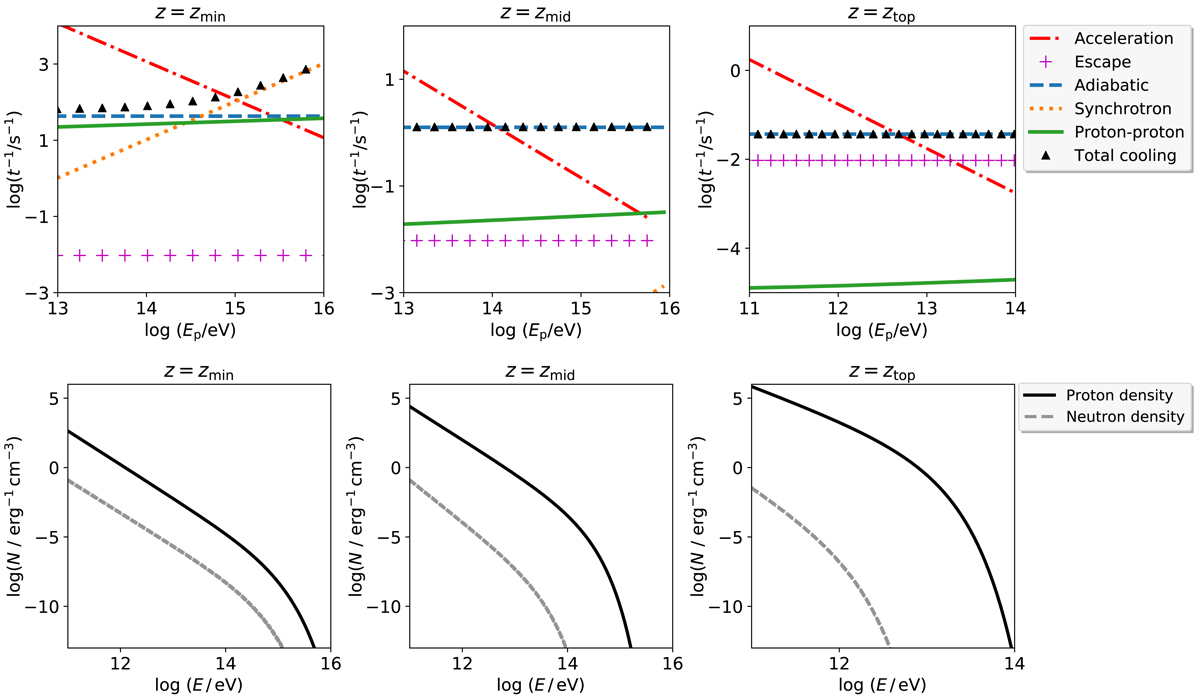
Energetics of hadrons at the base (zmin, left panels), logarithmic midpoint (zmid, middle panels), and top (ztop, right panels) of the acceleration region for the Cygnus X-1 model. Top: cooling and acceleration rates for protons. The plots show the loss rates for proton–proton (green, solid line), synchrotron (yellow, dotted line), escape (magenta, +symbols), and adiabatic losses (light blue, dashed line), the total loss rate (black triangles), and the acceleration rate (red, dash-dotted line). Bottom: proton (black, solid line) and neutron (grey, dashed line) densities for the same regions as the top plots. In all cases, adiabatic losses are dominant and the proton population is many orders of magnitude denser than the neutron one.
Current usage metrics show cumulative count of Article Views (full-text article views including HTML views, PDF and ePub downloads, according to the available data) and Abstracts Views on Vision4Press platform.
Data correspond to usage on the plateform after 2015. The current usage metrics is available 48-96 hours after online publication and is updated daily on week days.
Initial download of the metrics may take a while.