Fig. 3
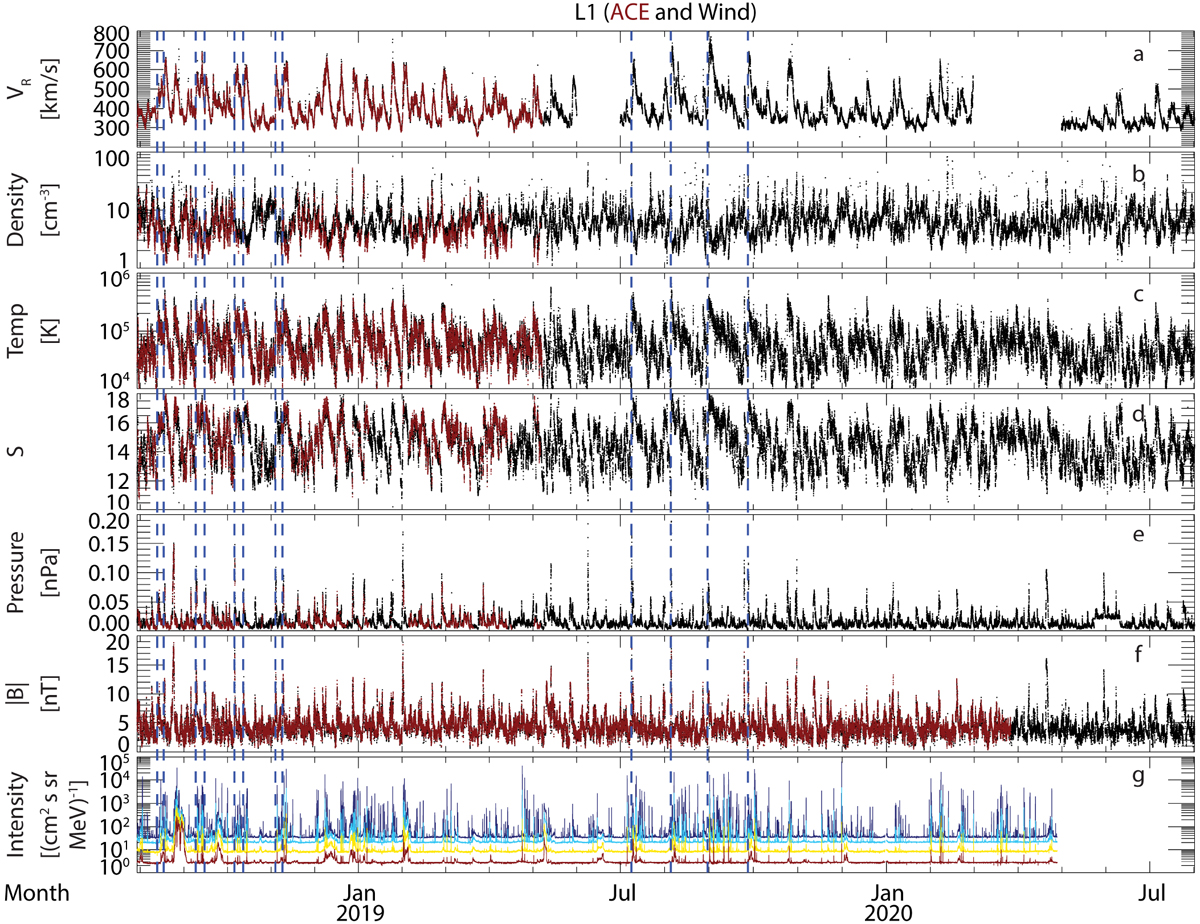
Overview of L1 observations (ACE in red and Wind in black for panels a–f) in the same format as Fig. 2. Panel g: suprathermal ion intensities for the energy range of 56–3020 keV from ACE-EPAM. Vertical blue dashed lines illustrate the times of SIR and CIR observations that were also observed by PSP.
Current usage metrics show cumulative count of Article Views (full-text article views including HTML views, PDF and ePub downloads, according to the available data) and Abstracts Views on Vision4Press platform.
Data correspond to usage on the plateform after 2015. The current usage metrics is available 48-96 hours after online publication and is updated daily on week days.
Initial download of the metrics may take a while.