Fig. 6
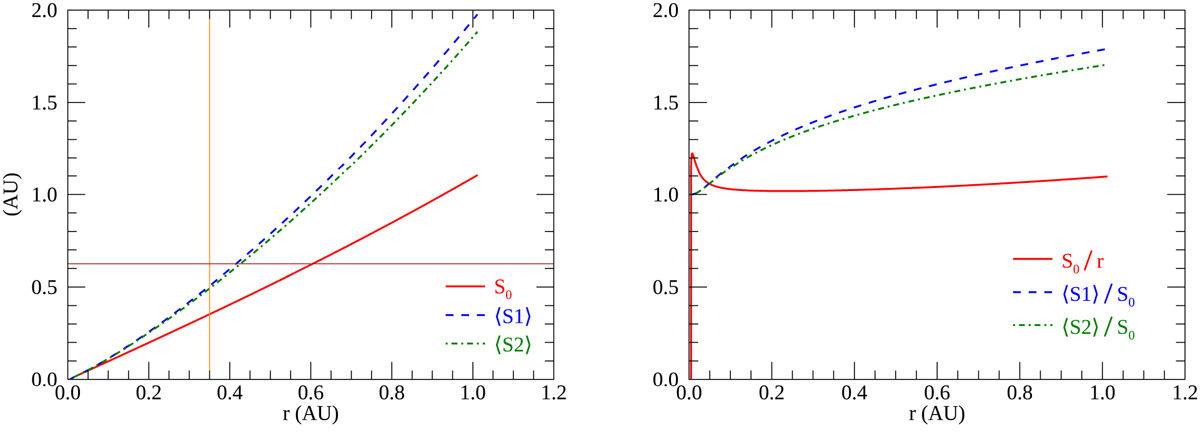
Path length S0 versus heliocentric distance r for a selected large-scale field line from a global heliospheric simulation based on a solar magnetogram for 28 May 2020, compared with two computations of the average path length of random-walking field lines associated with that particular large-scale field line. Here ⟨S1⟩ is based on the simple estimate in Sect. 3.1, while ⟨S2⟩ is based on the more rigorous formalism developed in Sect. 3.2 (see text). Both cases are for transverse fluctuations. In the left panel, the orange vertical line marks the location of PSP at the time of observation of the energetic ion events discussed in Sect. 5.2, and the brown horizontal line marks the particle path length inferred from these observations. See also Fig. 10.
Current usage metrics show cumulative count of Article Views (full-text article views including HTML views, PDF and ePub downloads, according to the available data) and Abstracts Views on Vision4Press platform.
Data correspond to usage on the plateform after 2015. The current usage metrics is available 48-96 hours after online publication and is updated daily on week days.
Initial download of the metrics may take a while.