Fig. 2
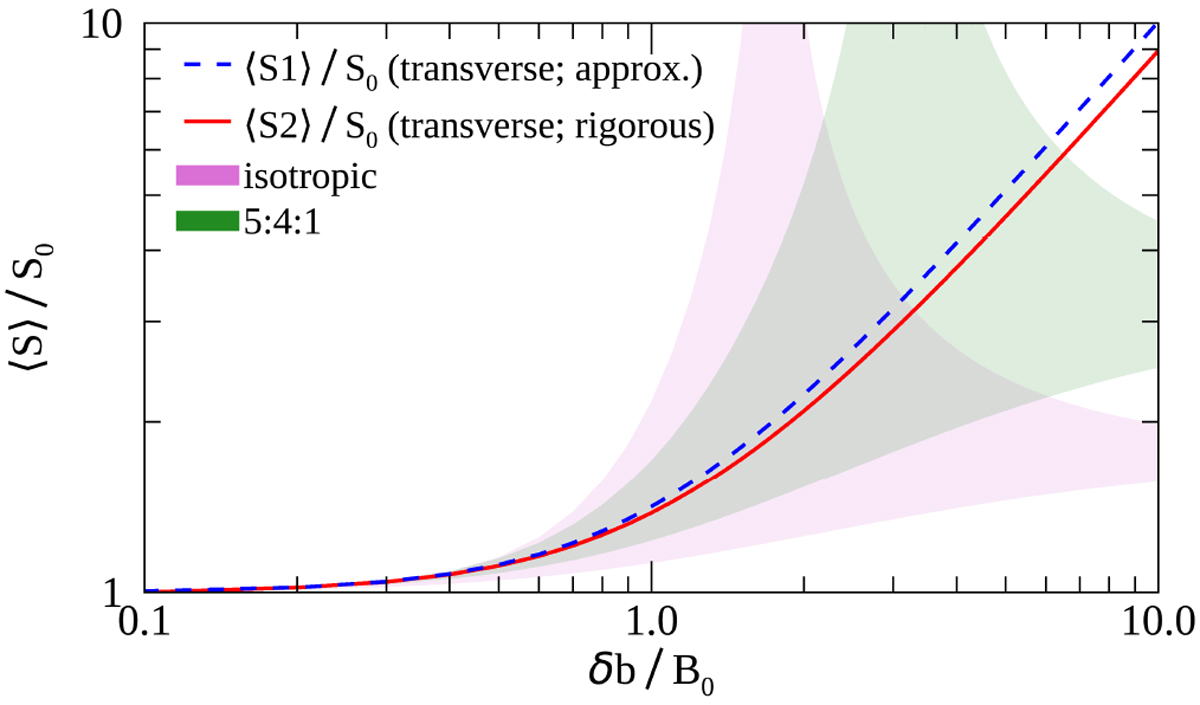
Ratio of path length ⟨S⟩ of random-walking field lines to path length S0 of the unperturbed field line, as a function of δb∕B0. Here ⟨S1⟩ is based on the simple estimate in Sect. 3.1, while ⟨S2⟩ is based on the more rigorous formalism developed in Sect. 3.2; both of these cases are for transverse fluctuations. The pink and green shaded regions represent the cases of isotropic (Eq. (7)) and 5:4:1 (Eq. (9)) fluctuations, respectively. The lower and upper bounds of the shaded regions correspond to the cases of positive and negative δbz, respectively (see Sect. 3.1).
Current usage metrics show cumulative count of Article Views (full-text article views including HTML views, PDF and ePub downloads, according to the available data) and Abstracts Views on Vision4Press platform.
Data correspond to usage on the plateform after 2015. The current usage metrics is available 48-96 hours after online publication and is updated daily on week days.
Initial download of the metrics may take a while.