Fig. 10
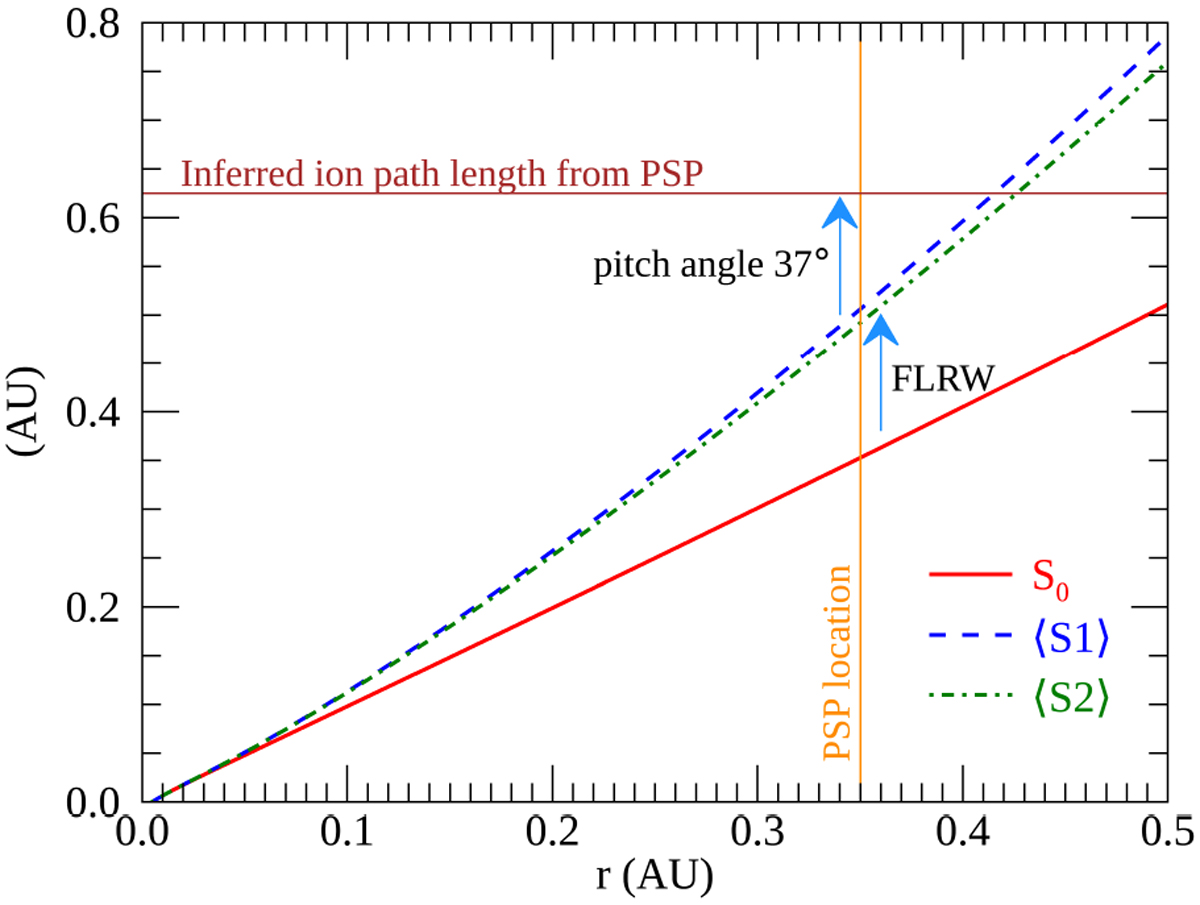
Blow up of Fig. 6, focusing on smaller heliocentric distances. Path length S0 for a large-scale field line from the global solar wind simulation is compared with two computations of path length of random-walking field lines (see caption of Fig. 6). The orange vertical line indicates the approximate radial position of PSP at the time of the events depicted in Fig. 8, and the brown horizontal line depicts the path length derived from the dispersion analysis of these events, shown in Fig. 9.
Current usage metrics show cumulative count of Article Views (full-text article views including HTML views, PDF and ePub downloads, according to the available data) and Abstracts Views on Vision4Press platform.
Data correspond to usage on the plateform after 2015. The current usage metrics is available 48-96 hours after online publication and is updated daily on week days.
Initial download of the metrics may take a while.