Fig. 7
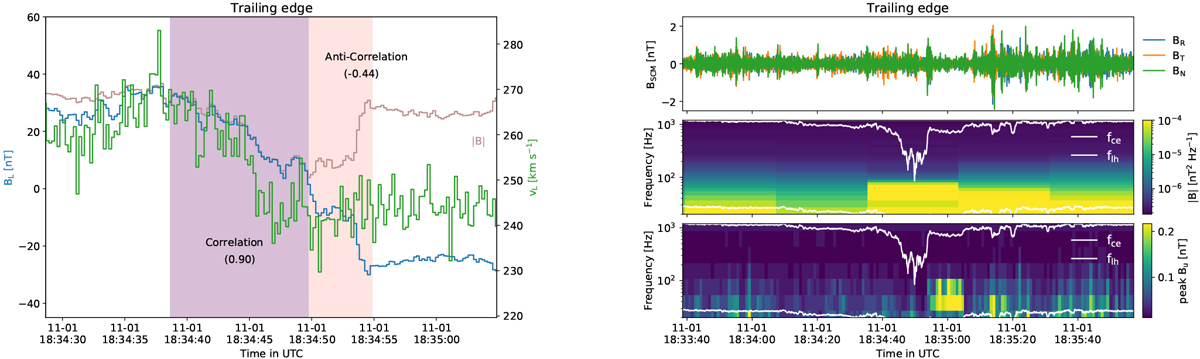
Evidence of reconnection at the trailing edge of event 3. Left panel: follows the same representation as in Fig. 2 but for event 3 and shows a correlation and anti-correlation of BL and vL. Right panels: whistler waves detected right after PSP crossed the current sheet. First panel: SCM waveforms in the RTN coordinates system. Second panel: cross-spectral measurement (trace of the spectral matrix). Third panel: BPF measurements (one component in the SCM sensor frame). For the last two panels, the white lines represent the lower hybrid and electron cyclotron frequencies, respectively.
Current usage metrics show cumulative count of Article Views (full-text article views including HTML views, PDF and ePub downloads, according to the available data) and Abstracts Views on Vision4Press platform.
Data correspond to usage on the plateform after 2015. The current usage metrics is available 48-96 hours after online publication and is updated daily on week days.
Initial download of the metrics may take a while.