Fig. 2
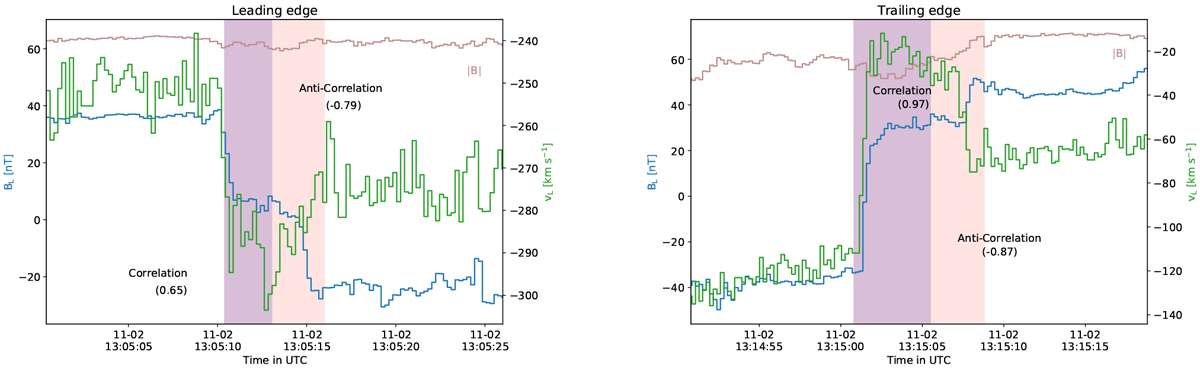
Correlation and anti-correlation of BL and vL at the boundaries of event 1. The leading edge is represented in the left panel and trailing edge in the right panel. Evolution of BL and vL, component along the main direction of the current sheets. The Pearson correlation coefficients shown were computed in the coloured time windows, chosen to maximise the correlation values. The light brown line is the magnitude of the magnetic field.
Current usage metrics show cumulative count of Article Views (full-text article views including HTML views, PDF and ePub downloads, according to the available data) and Abstracts Views on Vision4Press platform.
Data correspond to usage on the plateform after 2015. The current usage metrics is available 48-96 hours after online publication and is updated daily on week days.
Initial download of the metrics may take a while.