Fig. 1
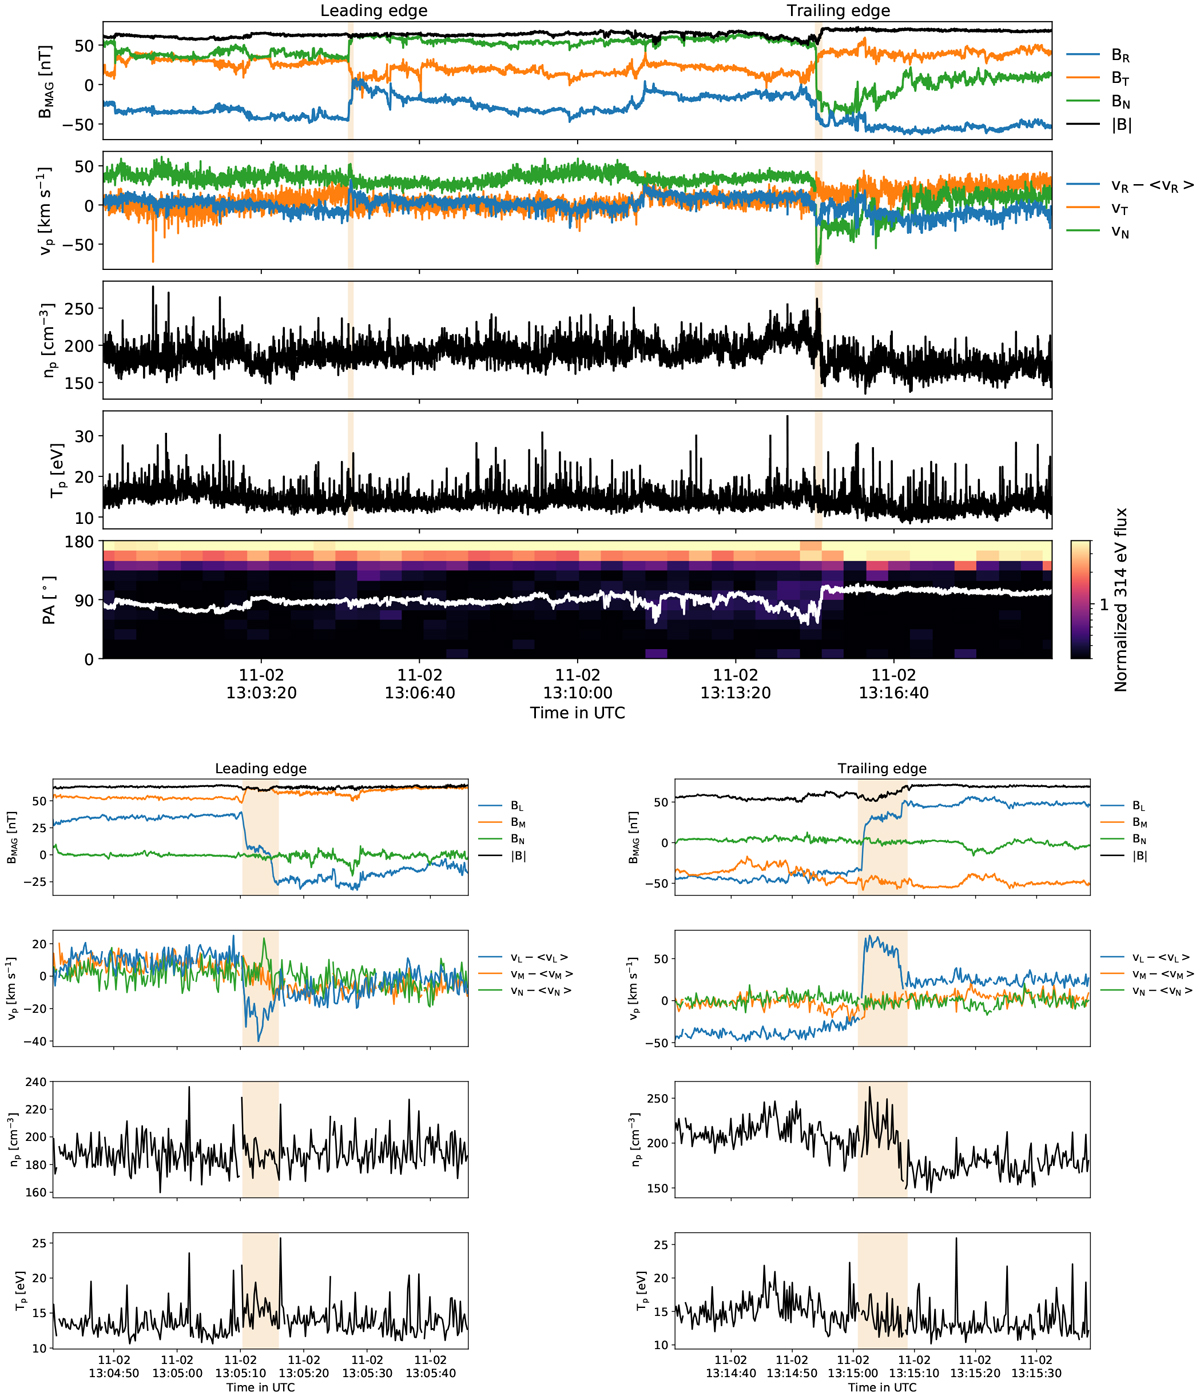
Event 1 on November 2, 2018, starting at 13:05:09 UT. The shaded areas delimit the boundaries of the switchback, noted as leading and trailing edges. First panel: DC magnetic field measurements from FIELDS/MAG in the RTN frame. Second panel: proton velocity from SWEAP/SPC, also in the RTN frame. The average value of the radial velocity (⟨vR ⟩ = 320 km s−1) was removed for easier visualisation. Third panel: proton density from SWEAP/SPC. Fourth panel: radial proton temperaturefrom SWEAP/SPC. Fifth panel: pitch angle distribution of 314 eV electrons from SWEAP/SPAN-E. The combined flux (two sensors) was normalised by the averaged flux. The white curve represents the magnitude of the magnetic field in arbitrary units. Bottom panels: two sets of plots at the bottom are excerpts of the leading and trailing edges of theswitchback; they represent the same variables (except for the pitch-angle distribution) in the same order. For these two sets of plots, the magnetic field and proton velocity are represented in the local current sheet coordinates LMN. The average value of the velocity for each component was removed for easier visualisation.
Current usage metrics show cumulative count of Article Views (full-text article views including HTML views, PDF and ePub downloads, according to the available data) and Abstracts Views on Vision4Press platform.
Data correspond to usage on the plateform after 2015. The current usage metrics is available 48-96 hours after online publication and is updated daily on week days.
Initial download of the metrics may take a while.