Fig. B.1.
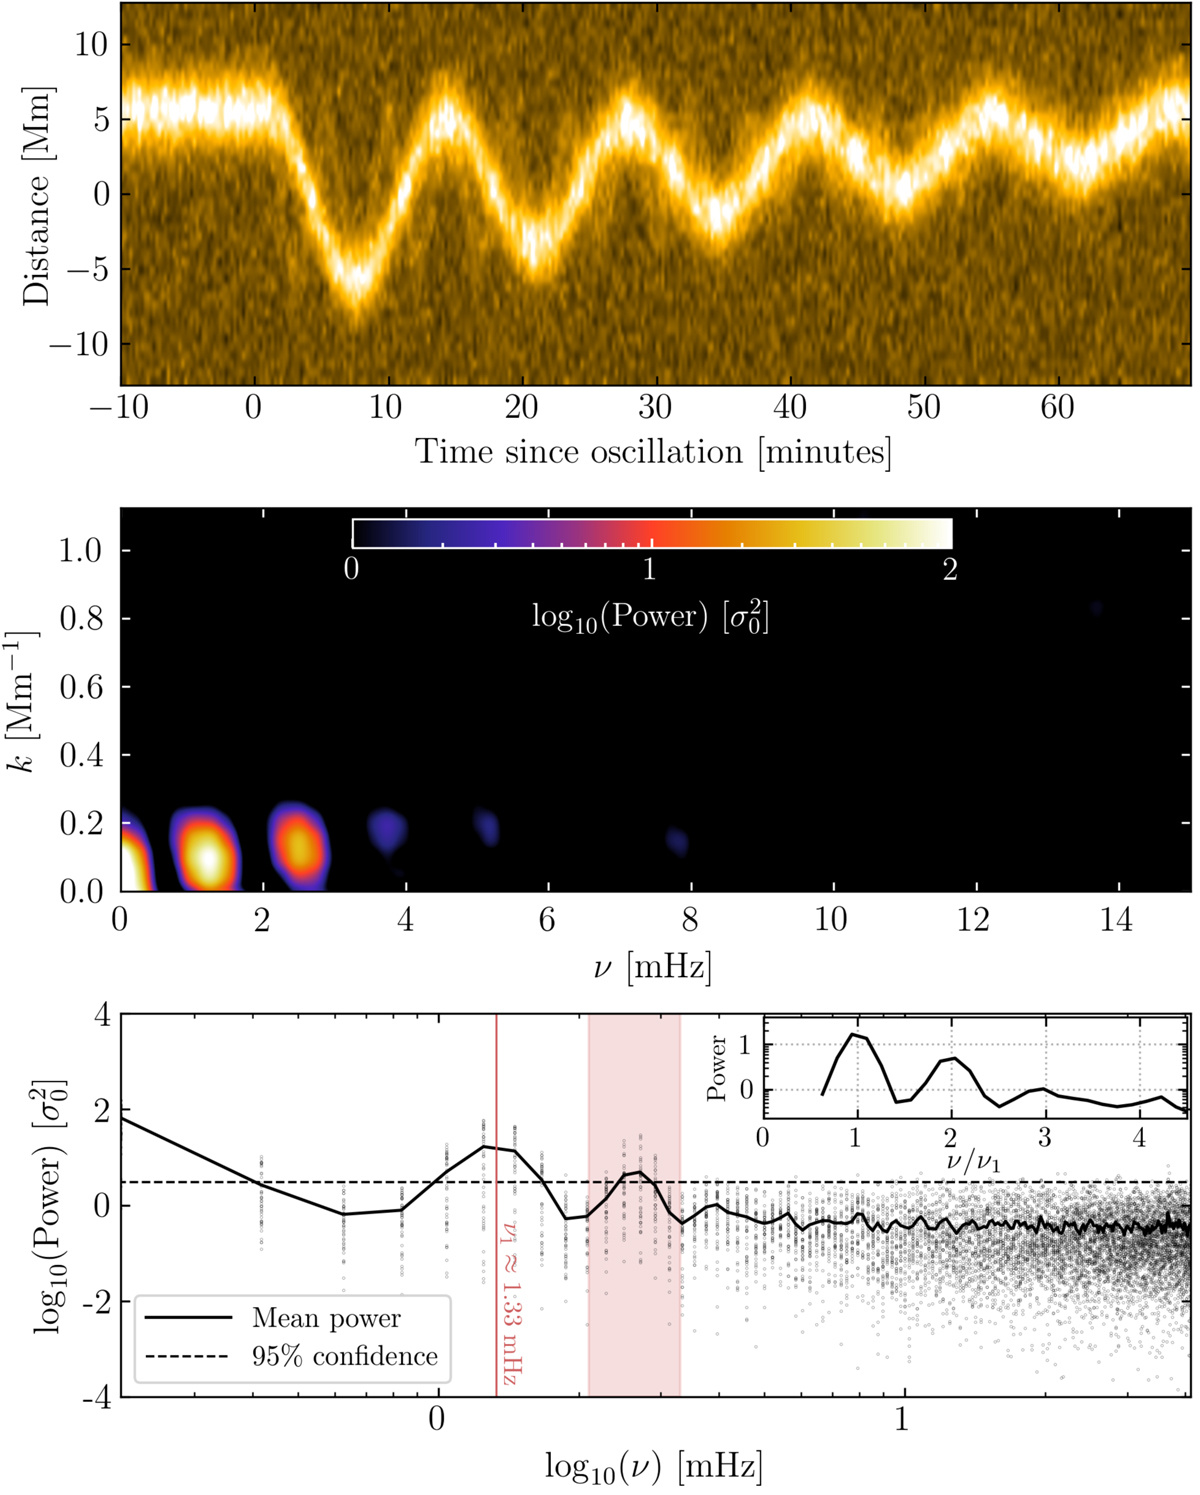
Same as Fig. 4 but for a faint background loop superposed onto the bright loop. The fundamental frequency of the faint loop (4 mHz) is 3 times that of the bright loop. The 1D FFT spectrum is almost identical to that of the single loop in Fig. 4. However, the 2D spectrum shows deviations at different k from the expected single loop, suggesting a high-frequency signal may be present.
Current usage metrics show cumulative count of Article Views (full-text article views including HTML views, PDF and ePub downloads, according to the available data) and Abstracts Views on Vision4Press platform.
Data correspond to usage on the plateform after 2015. The current usage metrics is available 48-96 hours after online publication and is updated daily on week days.
Initial download of the metrics may take a while.