Fig. A.1.
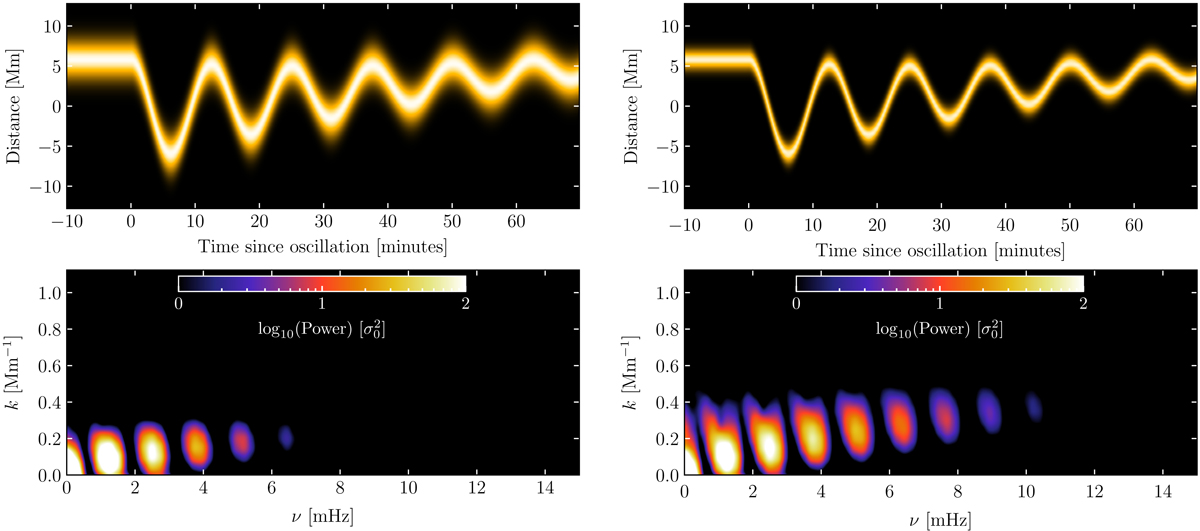
Simulated, noise-free time-distance maps (top) and their 2D power spectrum (bottom). Left panel: a thick (FWHM = 3.0 Mm) coronal loop oscillating at a single frequency of 1.33 mHz. Right panel: equivalent to the left panel but for a thin (FWHM = 1.5 Mm) loop. The relative increase in power at high frequencies, compared to the thick loop, arises due to the Fourier transform of a narrow Gaussian. In both cases, the harmonics arise owing to the periodic but non-sinusoidal waveform of the loop.
Current usage metrics show cumulative count of Article Views (full-text article views including HTML views, PDF and ePub downloads, according to the available data) and Abstracts Views on Vision4Press platform.
Data correspond to usage on the plateform after 2015. The current usage metrics is available 48-96 hours after online publication and is updated daily on week days.
Initial download of the metrics may take a while.