Fig. 6.
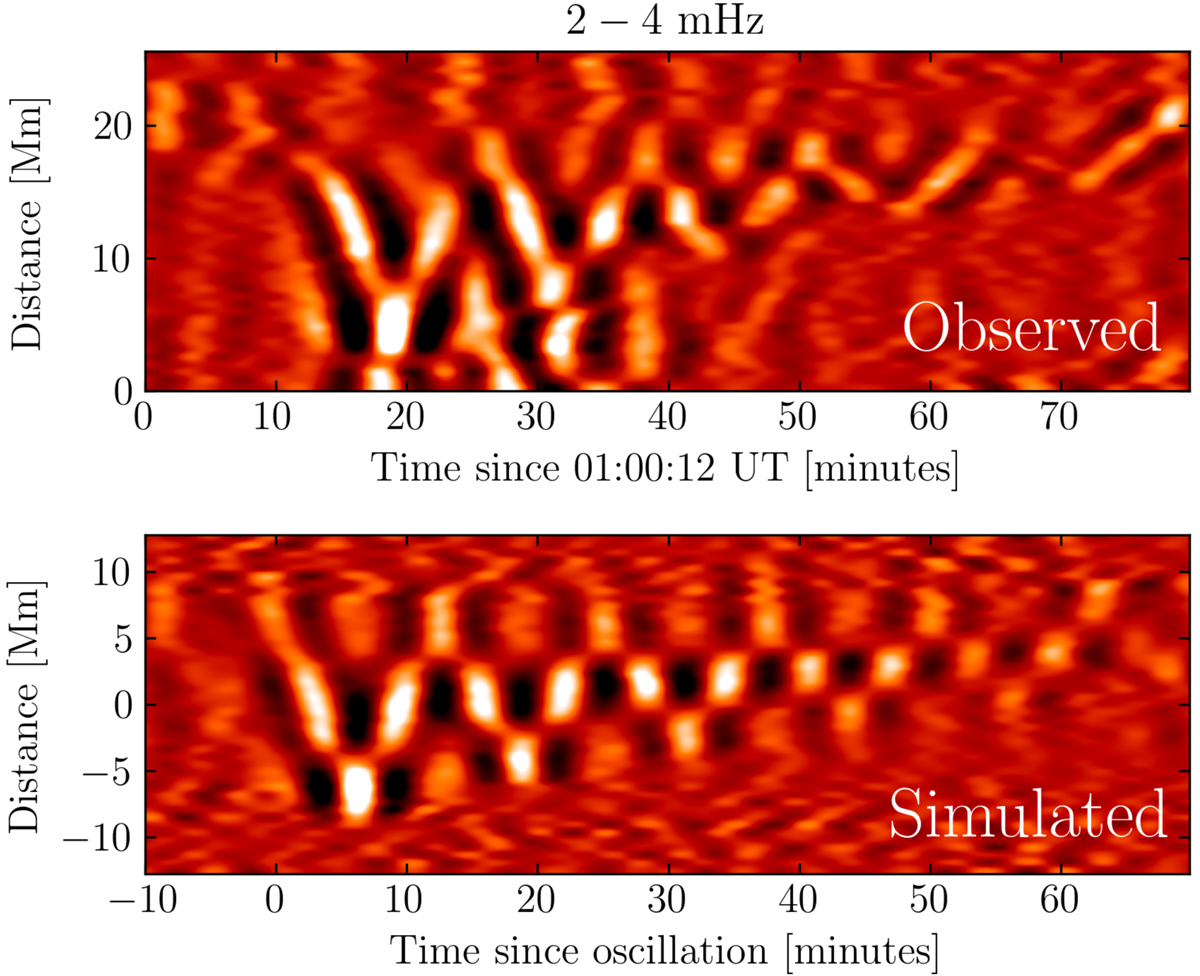
Reconstructed coronal loop waveforms (2–4 mHz) of the observed (top) and synthetic data (bottom). The dominant oscillatory (1.33 mHz) pattern is still visible despite diminishing its frequency. Signatures of small-scale oscillatory behaviour are also present. In both cases, these oscillations are completely artificial and arise owing to the non-uniform brightness of the loop in the presence of noise.
Current usage metrics show cumulative count of Article Views (full-text article views including HTML views, PDF and ePub downloads, according to the available data) and Abstracts Views on Vision4Press platform.
Data correspond to usage on the plateform after 2015. The current usage metrics is available 48-96 hours after online publication and is updated daily on week days.
Initial download of the metrics may take a while.