Fig. 4.
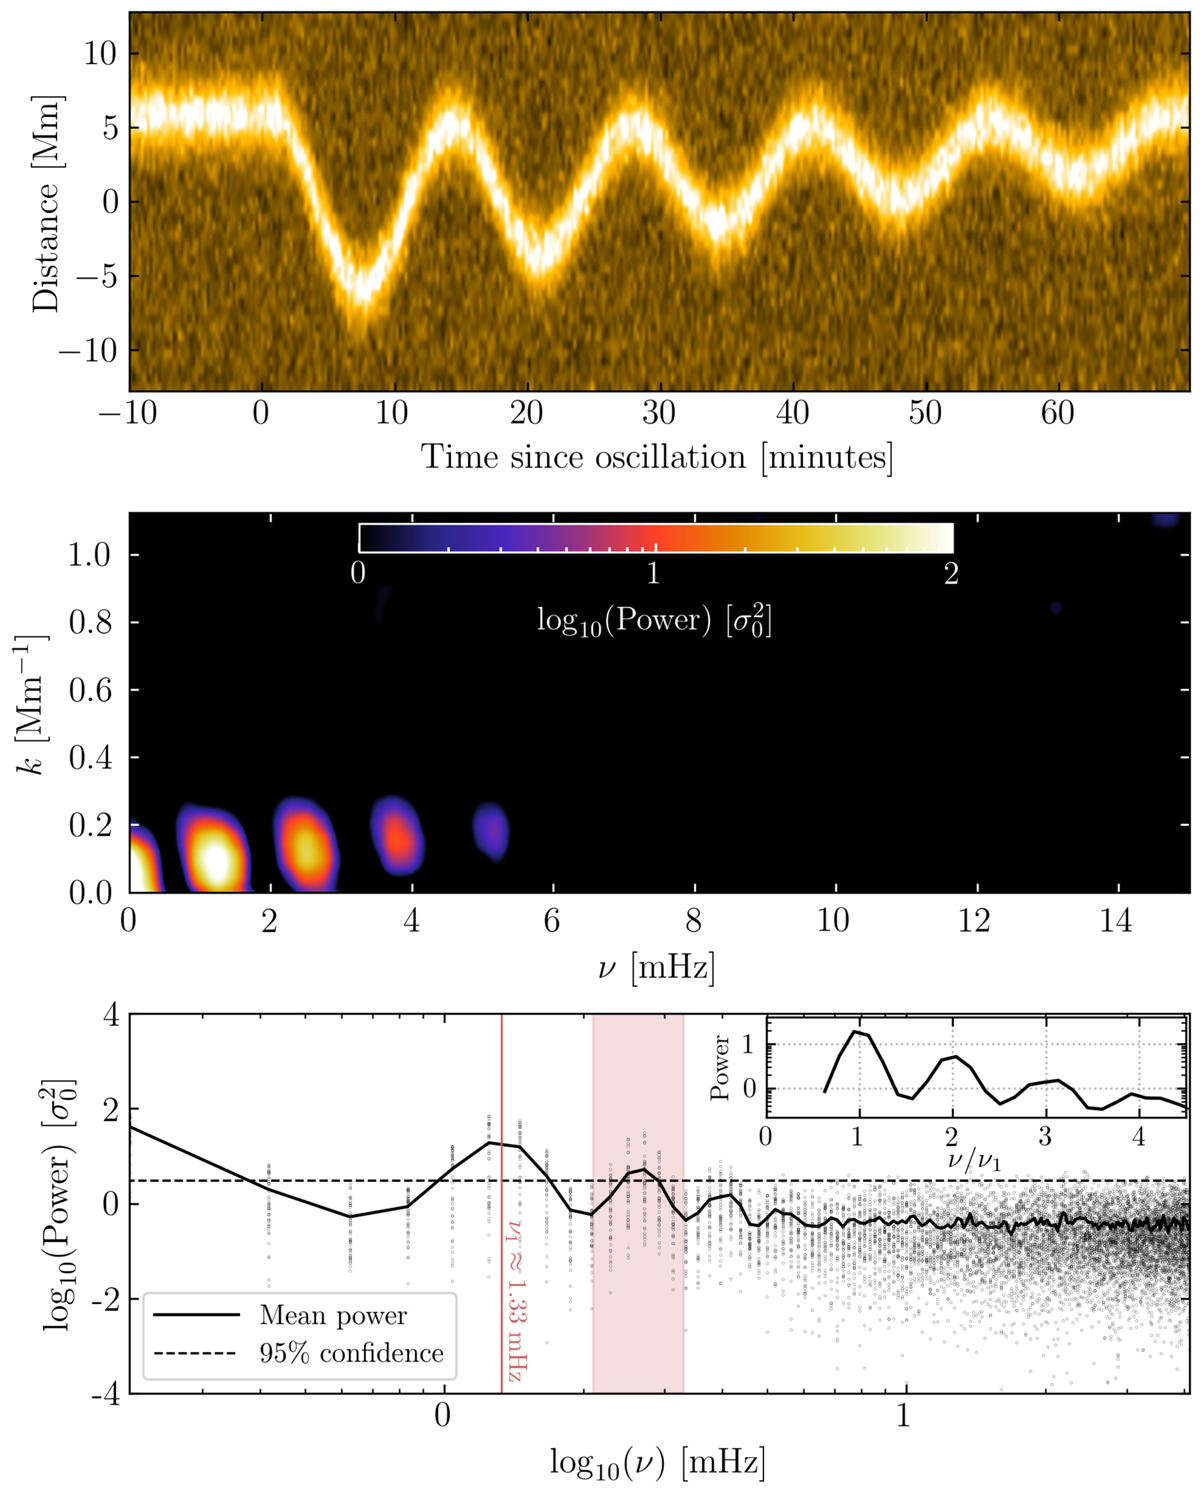
Basic simulation of a coronal loop that suddenly oscillates with a single periodicity of 13 min, embedded within a uniform background of noise. Top panel: synthetic time-distance map of a loop oscillating with a single periodicity that exhibits a slow exponential decay and linear drift along the slit. Poisson noise and white noise sources have been included. Middle panel: two-dimensional FFT power of the simulated waveform shown in the above panel. The pattern of frequencies is akin to the observed waveform shown in Fig. 2, that is the power peaks at 1.33 mHz and at several of its harmonics. Bottom panel: log-log plot of the FFT power of the synthetic waveform. The symbols and colours are the same as in Fig. 2.
Current usage metrics show cumulative count of Article Views (full-text article views including HTML views, PDF and ePub downloads, according to the available data) and Abstracts Views on Vision4Press platform.
Data correspond to usage on the plateform after 2015. The current usage metrics is available 48-96 hours after online publication and is updated daily on week days.
Initial download of the metrics may take a while.