Fig. 3.
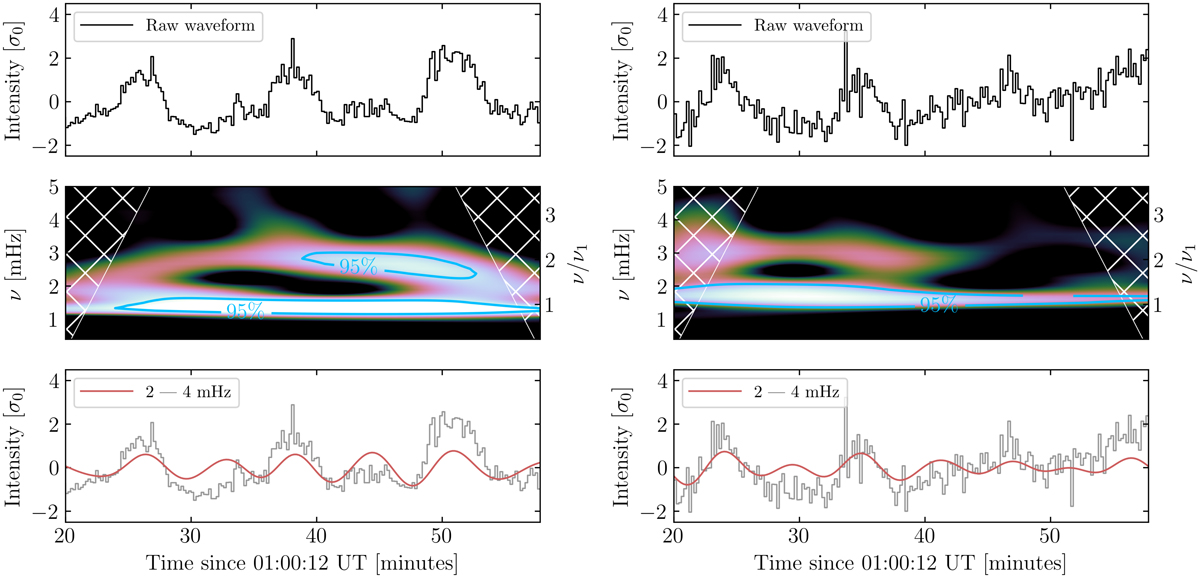
Analysis of the observed waveforms from the bright loop (left) and the faint oscillatory region (right) highlighted by the green lines in the bottom panel of Fig. 1. The top panels show the raw waveforms normalised with respect to the standard deviation. Ambient signatures of high-frequency signals are present in addition to the dominant 13 min oscillations. The middle panels shows the wavelet power of the raw signals. For the bright loop, two statistically significant oscillatory frequencies are present at approximately 1.33 mHz and 2.67 mHz, which is highlighted by the blue contours. The bottom panels show the 2–4 mHz bandpass filtered signals (red) overlaid onto the observed waveforms (grey). There are signatures of ∼6 min periodic signals superposed on the raw waveforms.
Current usage metrics show cumulative count of Article Views (full-text article views including HTML views, PDF and ePub downloads, according to the available data) and Abstracts Views on Vision4Press platform.
Data correspond to usage on the plateform after 2015. The current usage metrics is available 48-96 hours after online publication and is updated daily on week days.
Initial download of the metrics may take a while.