Fig. 2.
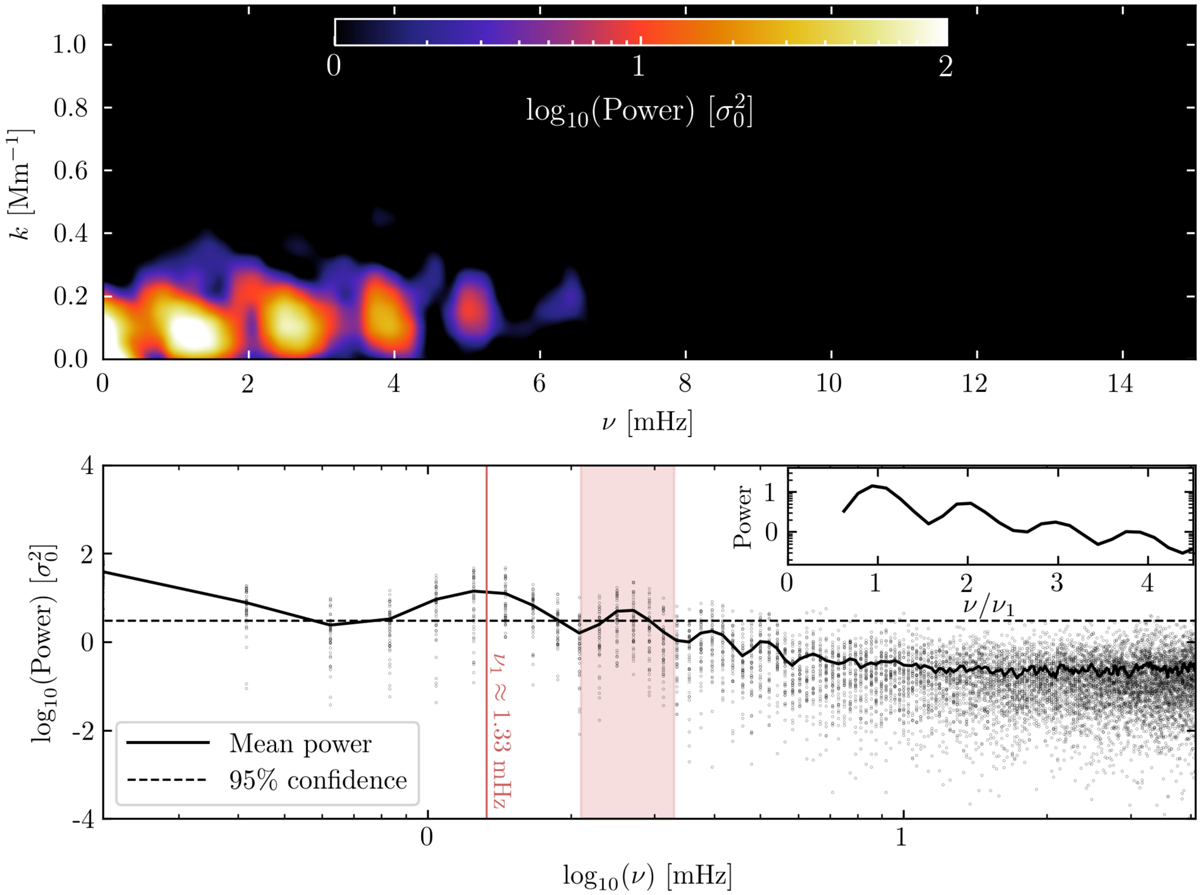
Top panel: two-dimensional FFT power spectrum of the time-distance map shown in the bottom panel of Fig. 1 as a function of spatial frequency, k, and temporal frequency, ν. The power is normalised with respect to the variance of the time series signal within each pixel. The peak power occurs at a fundamental frequency of ν1 ≈ 1.33 mHz, corresponding to the dominant 13 min period of the loop. Signatures of high-frequency components are also present at ν > ν1 with decreasing power. Bottom panel: log-log plot of the FFT power as a function of frequency. The black dots represent the distribution of spectral power within each pixel domain. The solid black line indicates the mean power and the dashed line indicates the 95% confidence level estimated from the theoretical white-noise spectrum. The shaded red region highlights a secondary significant frequency band with a peak at ∼2.67 mHz.
Current usage metrics show cumulative count of Article Views (full-text article views including HTML views, PDF and ePub downloads, according to the available data) and Abstracts Views on Vision4Press platform.
Data correspond to usage on the plateform after 2015. The current usage metrics is available 48-96 hours after online publication and is updated daily on week days.
Initial download of the metrics may take a while.