Fig. 1.
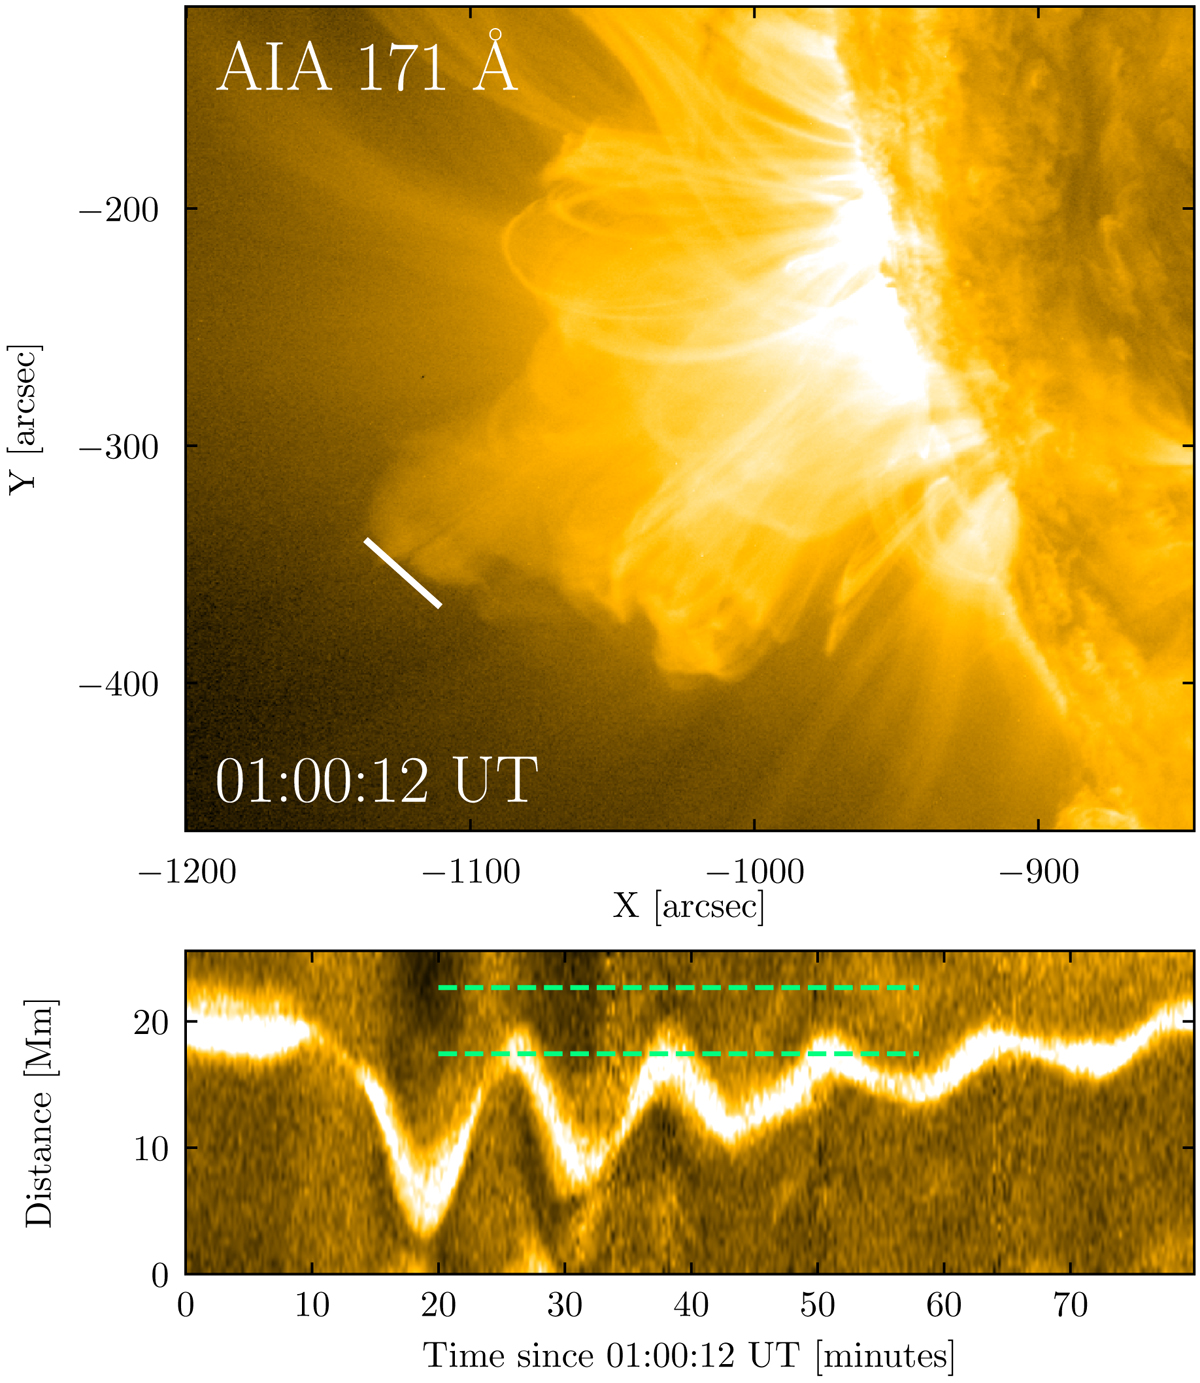
Top panel: snapshot of our region of interest observed by SDO/AIA at 01:00:12 UT. The origin of our slit corresponds to (x, y) = (−1111, −366) arcsec. Bottom panel: time-distance map of a bright coronal loop exhibiting clear transverse oscillations with a dominant periodicity of ∼13 min. The dashed green lines highlight the two pixel locations used for further analysis.
Current usage metrics show cumulative count of Article Views (full-text article views including HTML views, PDF and ePub downloads, according to the available data) and Abstracts Views on Vision4Press platform.
Data correspond to usage on the plateform after 2015. The current usage metrics is available 48-96 hours after online publication and is updated daily on week days.
Initial download of the metrics may take a while.