Fig. A.1
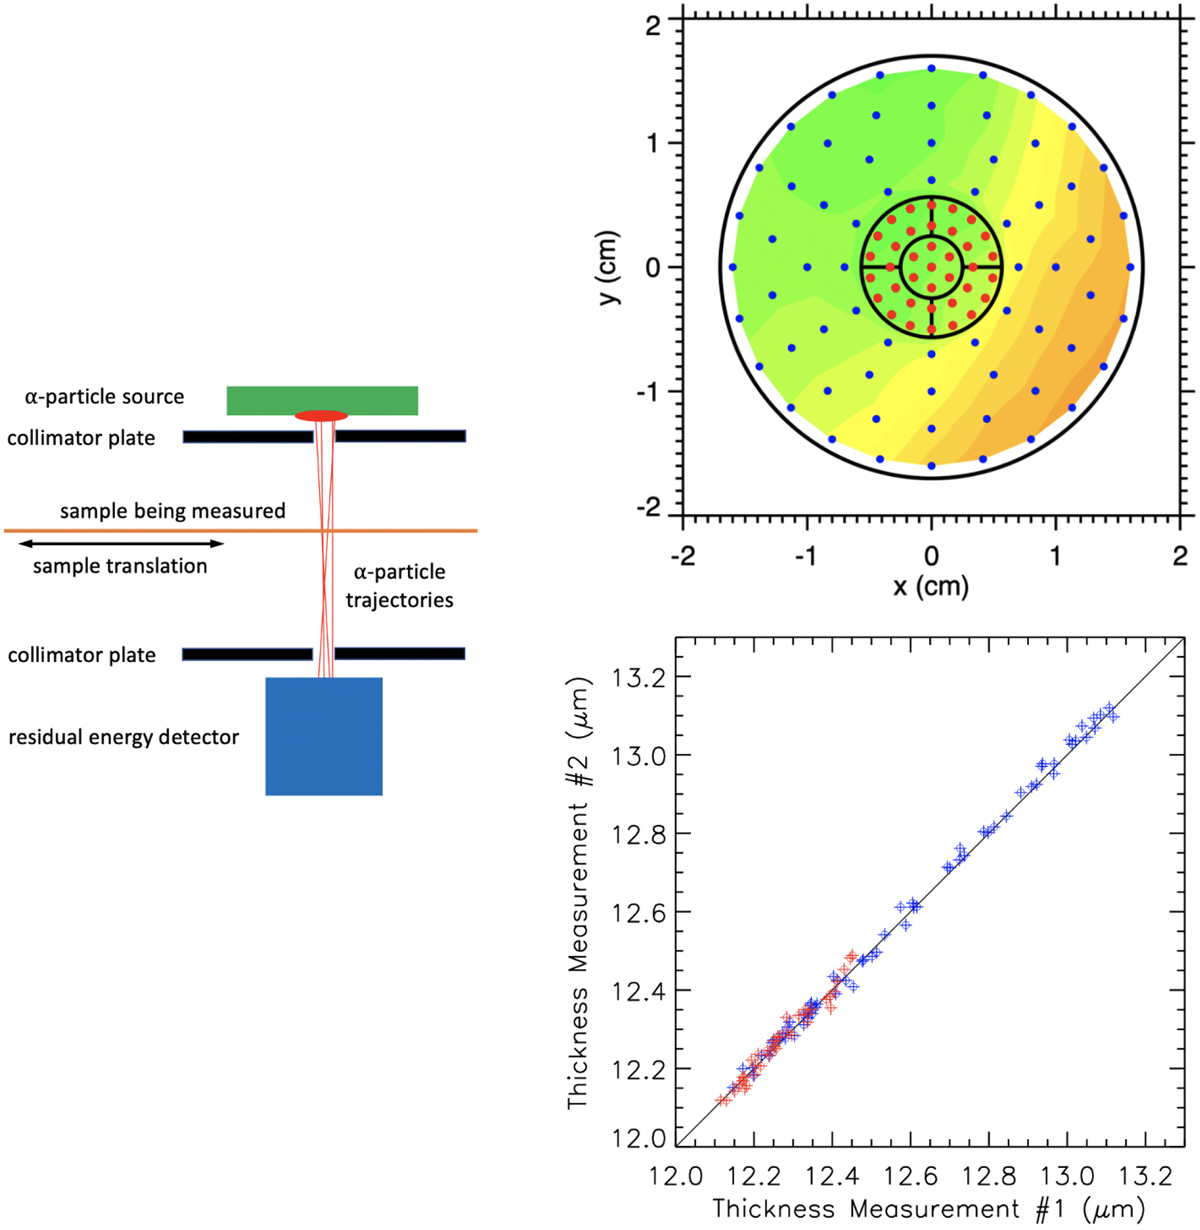
Left: schematic illustration of the setup used for mapping detector thicknesses. The locations of all parts were fixed relative to one another other than the sample being measured, which was translated in two dimensions perpendicular to the beam of α particles. Top right: locations at which measurements were made superimposed on the color contour map from Fig. 4. The red points are located within the active region of the detector; the blue points are located in the inactive peripheral region. The radius of the alpha beam at the detector was comparable to the distance between adjacent points in the active region. Bottom right: comparison of thicknesses derived from two separate runs mapping the same L0 detector. The error bars were derived from the statistical uncertainties in the mean positions of the Gaussians fitted to the residual energy distributions. Red (blue) indicates active (inactive) region points, as in the top right panel.
Current usage metrics show cumulative count of Article Views (full-text article views including HTML views, PDF and ePub downloads, according to the available data) and Abstracts Views on Vision4Press platform.
Data correspond to usage on the plateform after 2015. The current usage metrics is available 48-96 hours after online publication and is updated daily on week days.
Initial download of the metrics may take a while.