Fig. 4
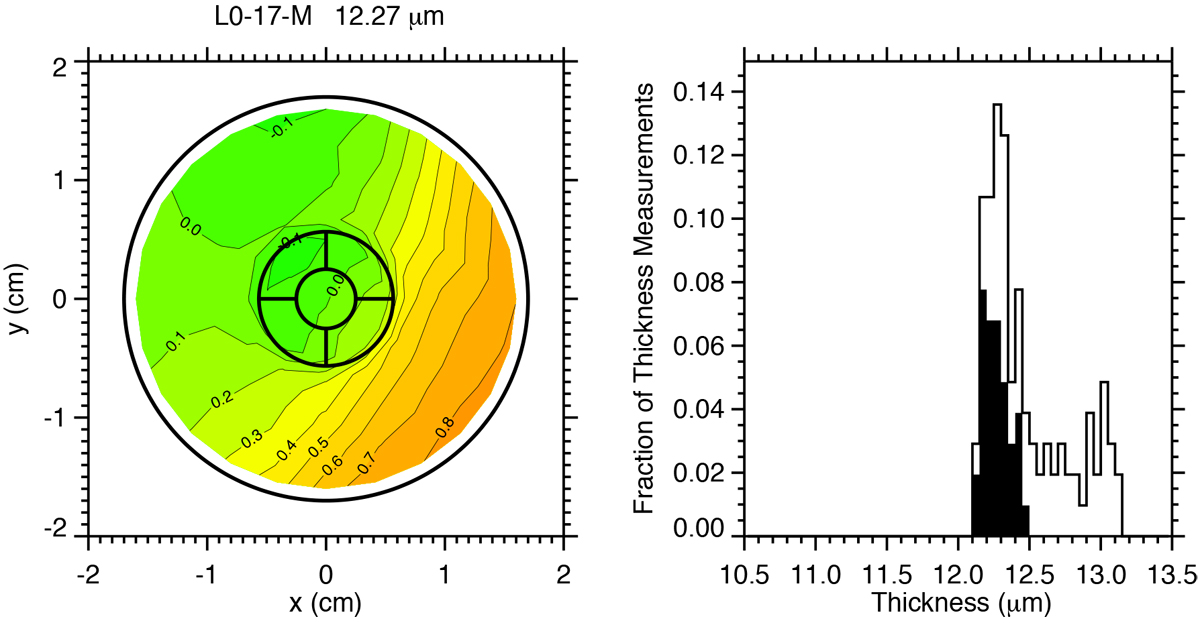
Thickness measurements made over the thin area of an L0 detector. Left: contour map of thickness deviations from the value 12.27 μm at the central position. Right: histograms of thickness measurements in the central active area (filled) and over the full thin area (unfilled). The distribution of measurement locations across the membrane is shown in Fig. A.1.
Current usage metrics show cumulative count of Article Views (full-text article views including HTML views, PDF and ePub downloads, according to the available data) and Abstracts Views on Vision4Press platform.
Data correspond to usage on the plateform after 2015. The current usage metrics is available 48-96 hours after online publication and is updated daily on week days.
Initial download of the metrics may take a while.