Fig. 8.
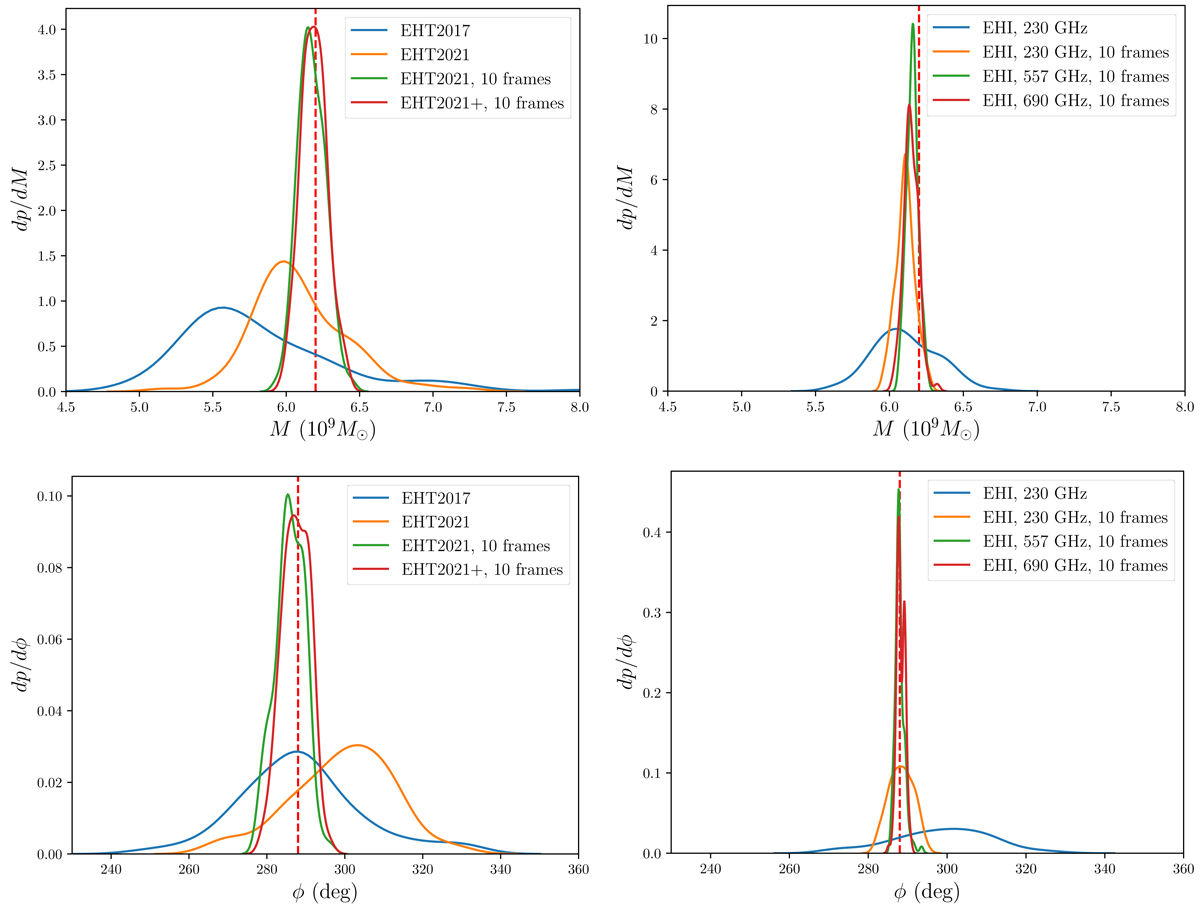
Best-fit mass (top) and sky orientation (bottom) distributions from fitting the frames or averages of ten frames of the input model (SANE, a* = 0.5, Rhigh = 80) to synthetic data generated either from frame 20 of this model or a random selection of ten frames from this model, using a ground (left) or space-based (right) array. The blue and orange line in the top left panel correspond to the distributions in the red ellipse in Fig. 4, and the blue and orange line in the bottom left panel correspond to the distributions in the red ellipse in Fig. 5. The true input mass and sky orientations are indicated with a red dashed line.
Current usage metrics show cumulative count of Article Views (full-text article views including HTML views, PDF and ePub downloads, according to the available data) and Abstracts Views on Vision4Press platform.
Data correspond to usage on the plateform after 2015. The current usage metrics is available 48-96 hours after online publication and is updated daily on week days.
Initial download of the metrics may take a while.