Fig. 4.
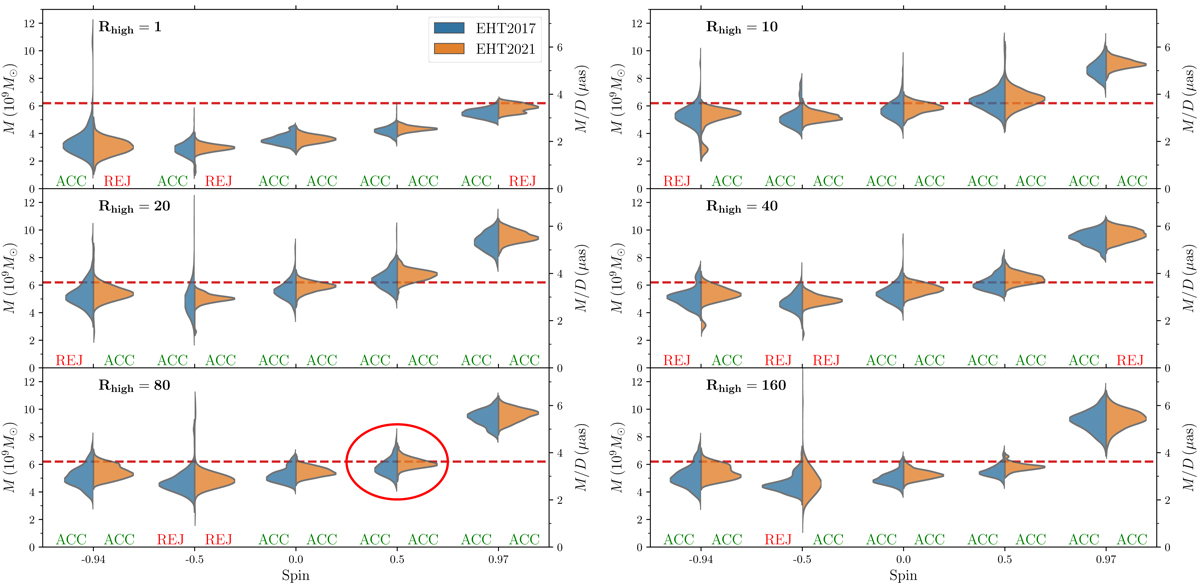
Mass distributions with best-fit values of all SANE model frames fit to the EHT2017 (blue) and EHT2021 (orange) synthetic data generated from frame 20 of the SANE model with a* = 0.5 and Rhigh = 80. The six panels correspond to the six values of Rhigh in the model library, and the black hole spin is on the horizontal axis. The red dashed line indicates the true mass of the input model (encircled). The models corresponding to the distributions with annotation “ACC” and “REJ” were accepted and rejected, respectively, by the average image scoring procedure.
Current usage metrics show cumulative count of Article Views (full-text article views including HTML views, PDF and ePub downloads, according to the available data) and Abstracts Views on Vision4Press platform.
Data correspond to usage on the plateform after 2015. The current usage metrics is available 48-96 hours after online publication and is updated daily on week days.
Initial download of the metrics may take a while.