Fig. 3.
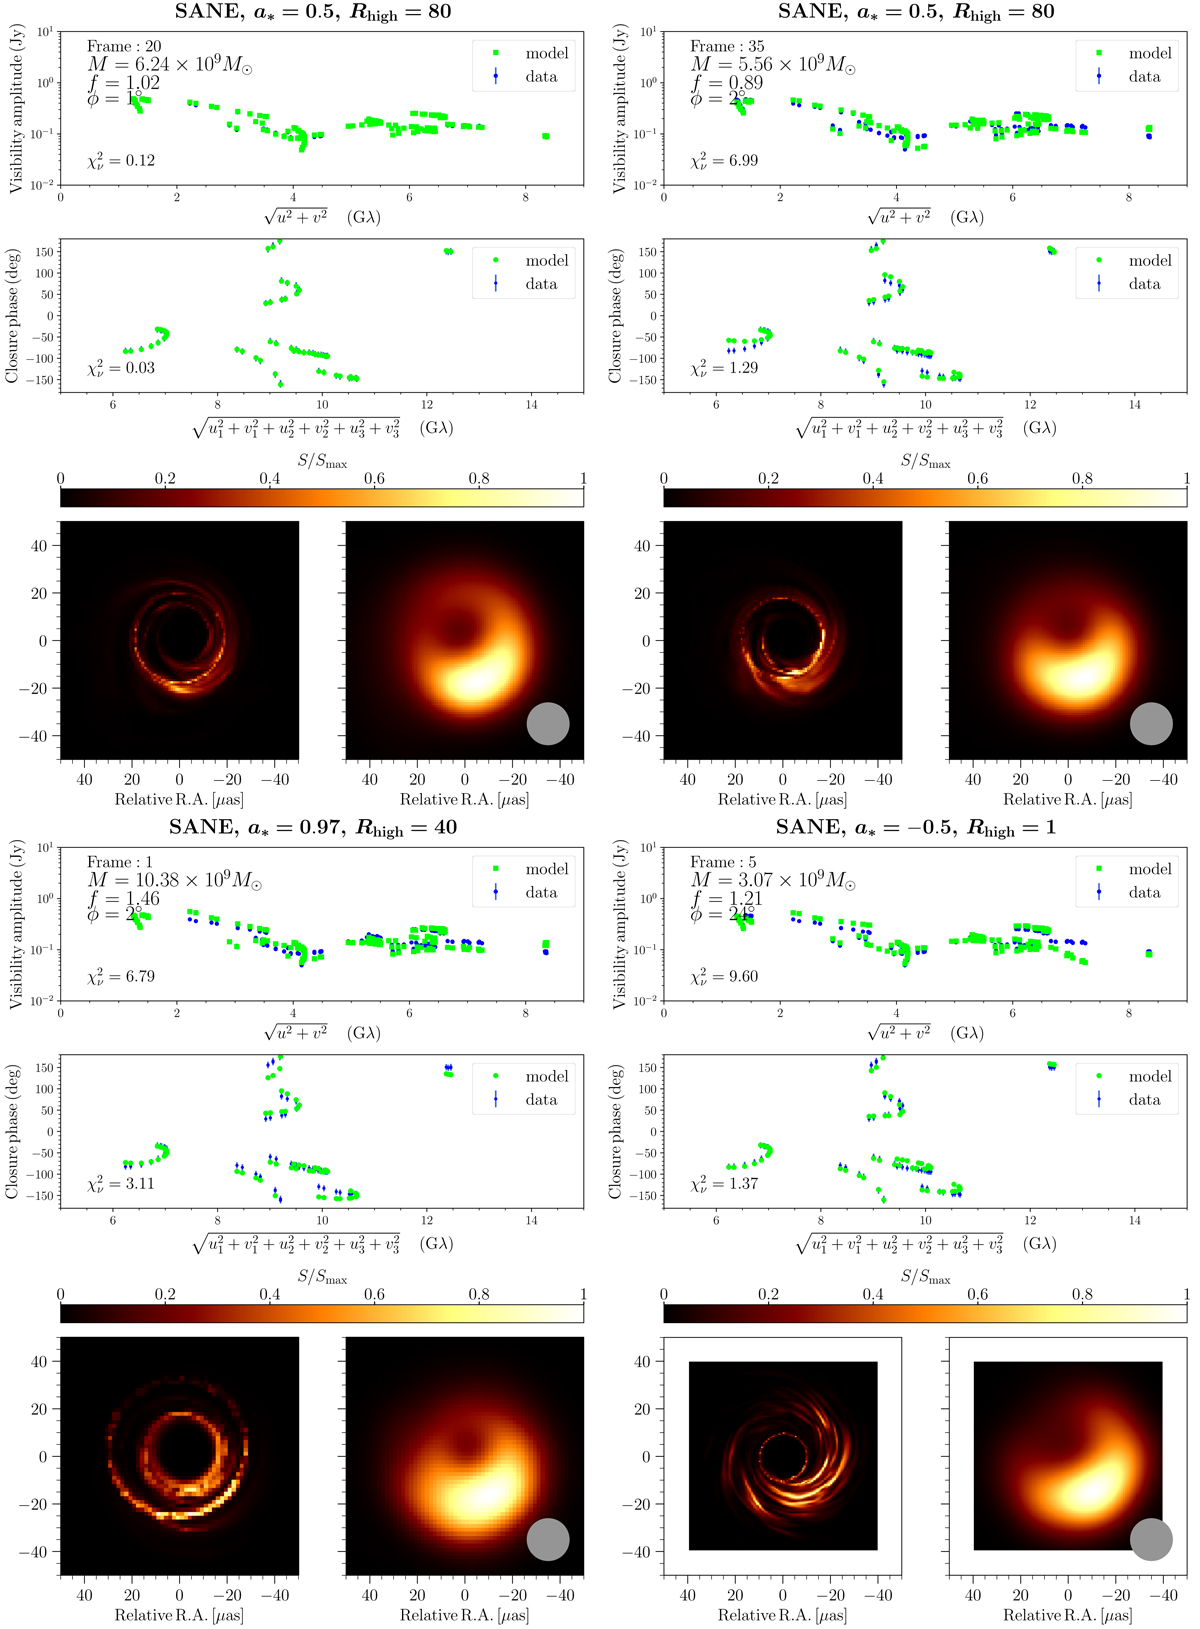
Four example fits to visibility amplitudes (upper panels) and closure phases (middle panels) of the EHT2017 synthetic data generated from frame 20 of the SANE model with a* = 0.5 and Rhigh = 80. Lower panels: model frames that were scaled and rotated by the best-fit values indicated in the upper panels, without (left) and with (right) blurring by a 20 μas Gaussian beam.
Current usage metrics show cumulative count of Article Views (full-text article views including HTML views, PDF and ePub downloads, according to the available data) and Abstracts Views on Vision4Press platform.
Data correspond to usage on the plateform after 2015. The current usage metrics is available 48-96 hours after online publication and is updated daily on week days.
Initial download of the metrics may take a while.