Fig. 13.
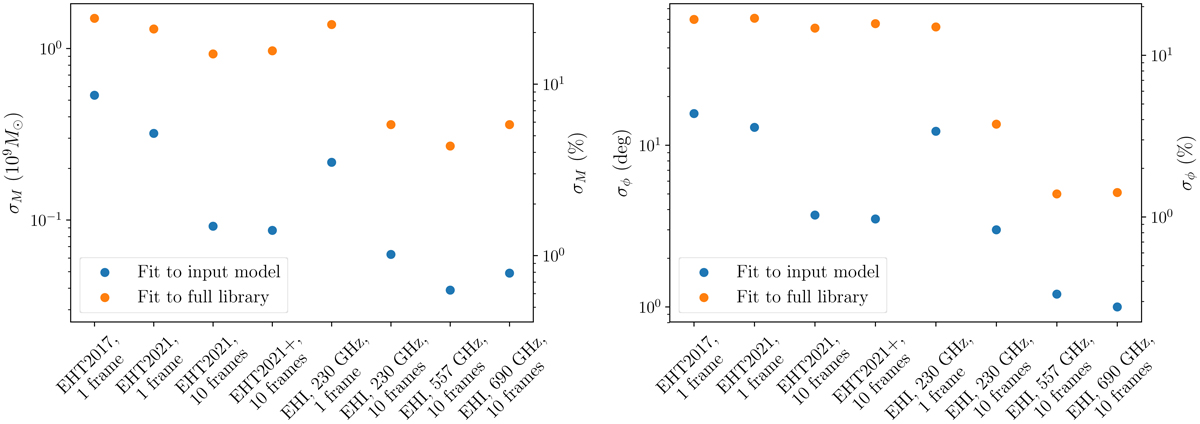
σM (left panel) and σϕ (right panel) values and percentages from fitting synthetic data from different observations to the input model (SANE, a* = 0.5, Rhigh = 80) and the full GRMHD library. The values are from Tables 1 and 3. The percentages are relative to the true input mass of 6.2 × 10⁹ M⊙ and the full 360° circle for σM and σϕ, respectively.
Current usage metrics show cumulative count of Article Views (full-text article views including HTML views, PDF and ePub downloads, according to the available data) and Abstracts Views on Vision4Press platform.
Data correspond to usage on the plateform after 2015. The current usage metrics is available 48-96 hours after online publication and is updated daily on week days.
Initial download of the metrics may take a while.