Fig. 9.
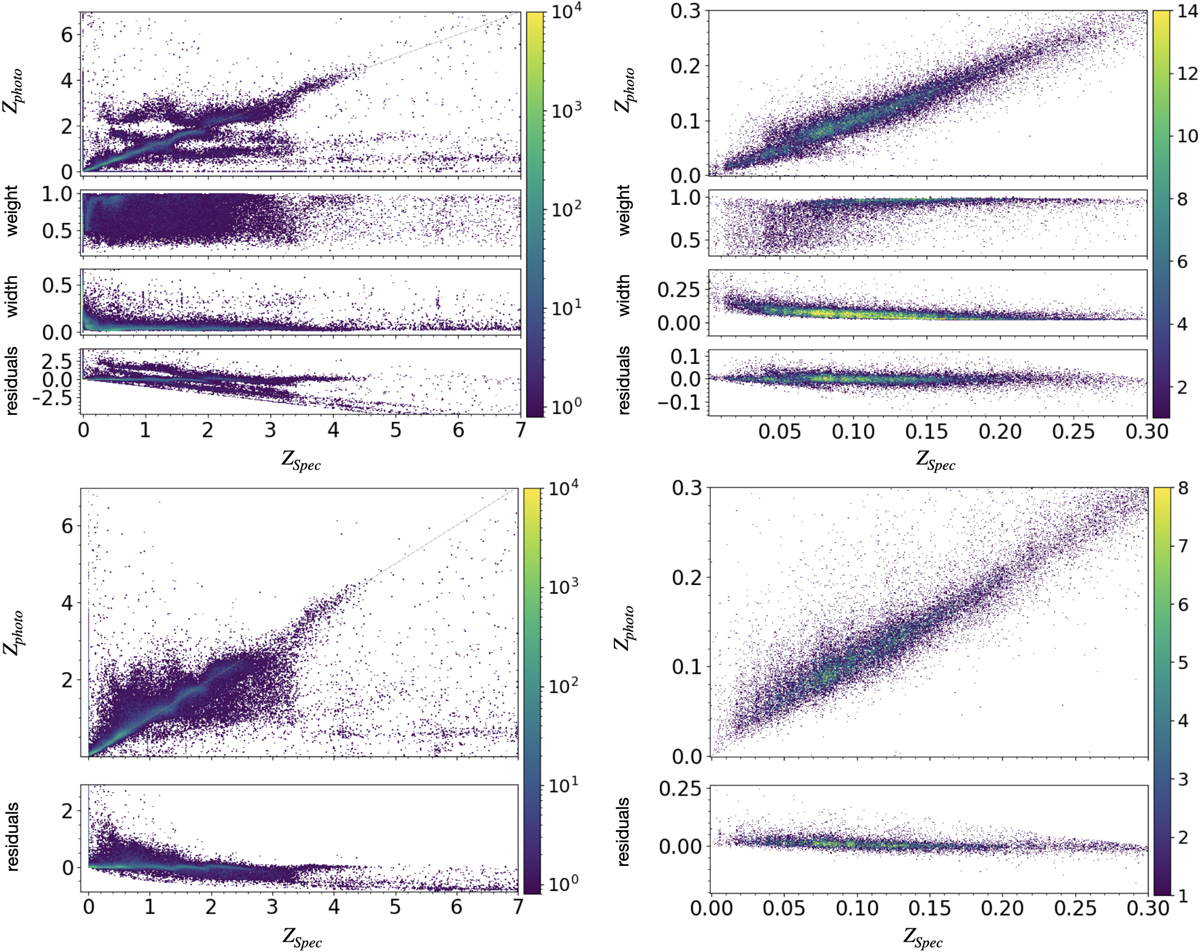
Comparison of spectroscopic vs. MDN photometric redshifts. The photometric redshifts are taken from the partially supervised ‘spec. class’ IGMM implementation (as described in Sect. 2.2). The colour-scales indicate the number of objects. Top panels: predicted photometric redshifts that correspond to the branches with the highest weights. The single panels show the weights, dispersions (denoted by ‘width’) and residuals from top to bottom. Bottom panels: mean photometric redshifts of the predicted redshifts over all branches with respect to their weights. Lower panel: residuals. Left panels: include all classes with zspec < 7. Right panels: include all galaxies with zspec < 0.3.
Current usage metrics show cumulative count of Article Views (full-text article views including HTML views, PDF and ePub downloads, according to the available data) and Abstracts Views on Vision4Press platform.
Data correspond to usage on the plateform after 2015. The current usage metrics is available 48-96 hours after online publication and is updated daily on week days.
Initial download of the metrics may take a while.