Fig. 5.
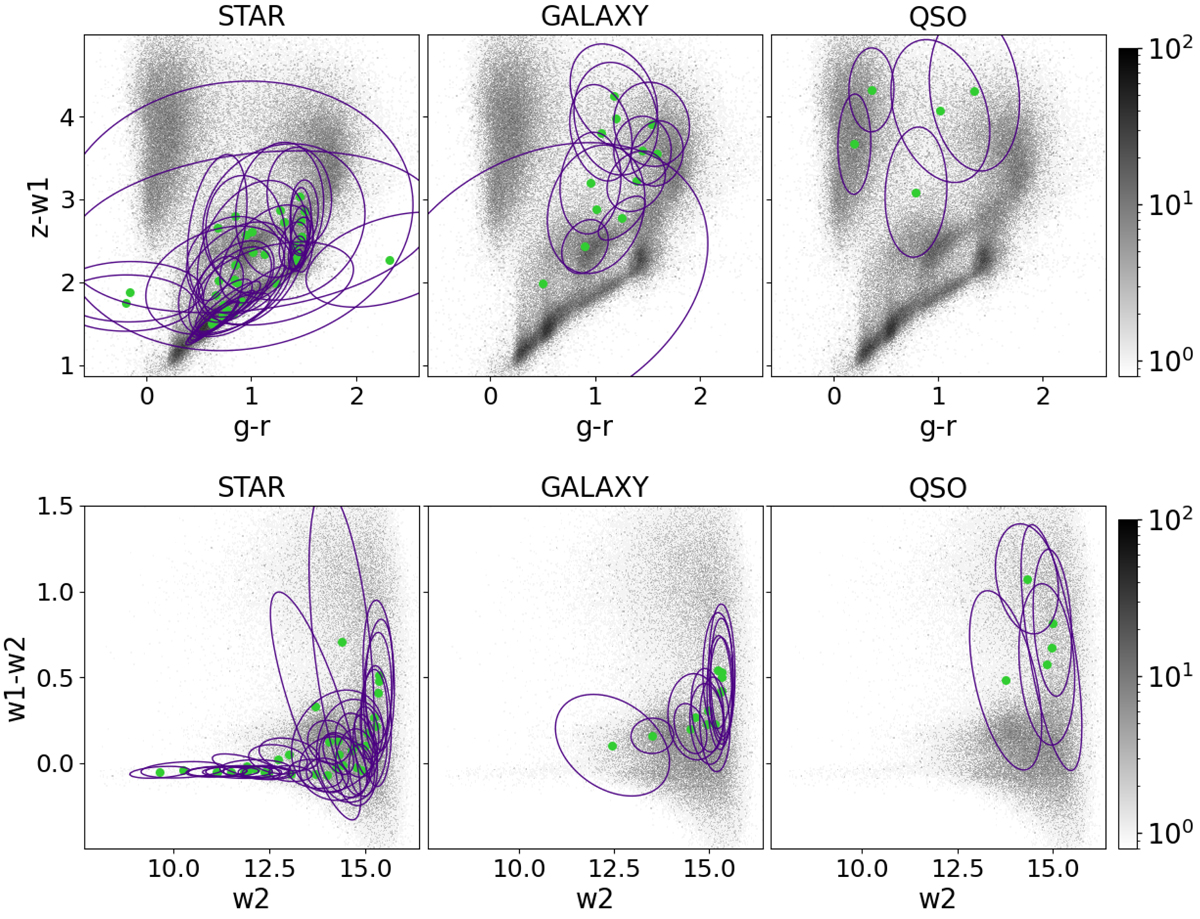
Colour-colour and colour-magnitude diagrams. Shown are g − r vs. z − W1 colour-colour diagrams (upper panel) and W2 vs. W1 − W2 colour-magnitude diagrams (bottom panel) for a populations of objects from the spectroscopic data set such as stars (left column), galaxies (middle column) and quasars (right column). The purple contours correspond to the 68th percentile of each Gaussian IGMM component. The green filled circles correspond to the means μk of the Gaussian components. The grey scale indicates the abundance of the sources in each diagram.
Current usage metrics show cumulative count of Article Views (full-text article views including HTML views, PDF and ePub downloads, according to the available data) and Abstracts Views on Vision4Press platform.
Data correspond to usage on the plateform after 2015. The current usage metrics is available 48-96 hours after online publication and is updated daily on week days.
Initial download of the metrics may take a while.