Fig. 8
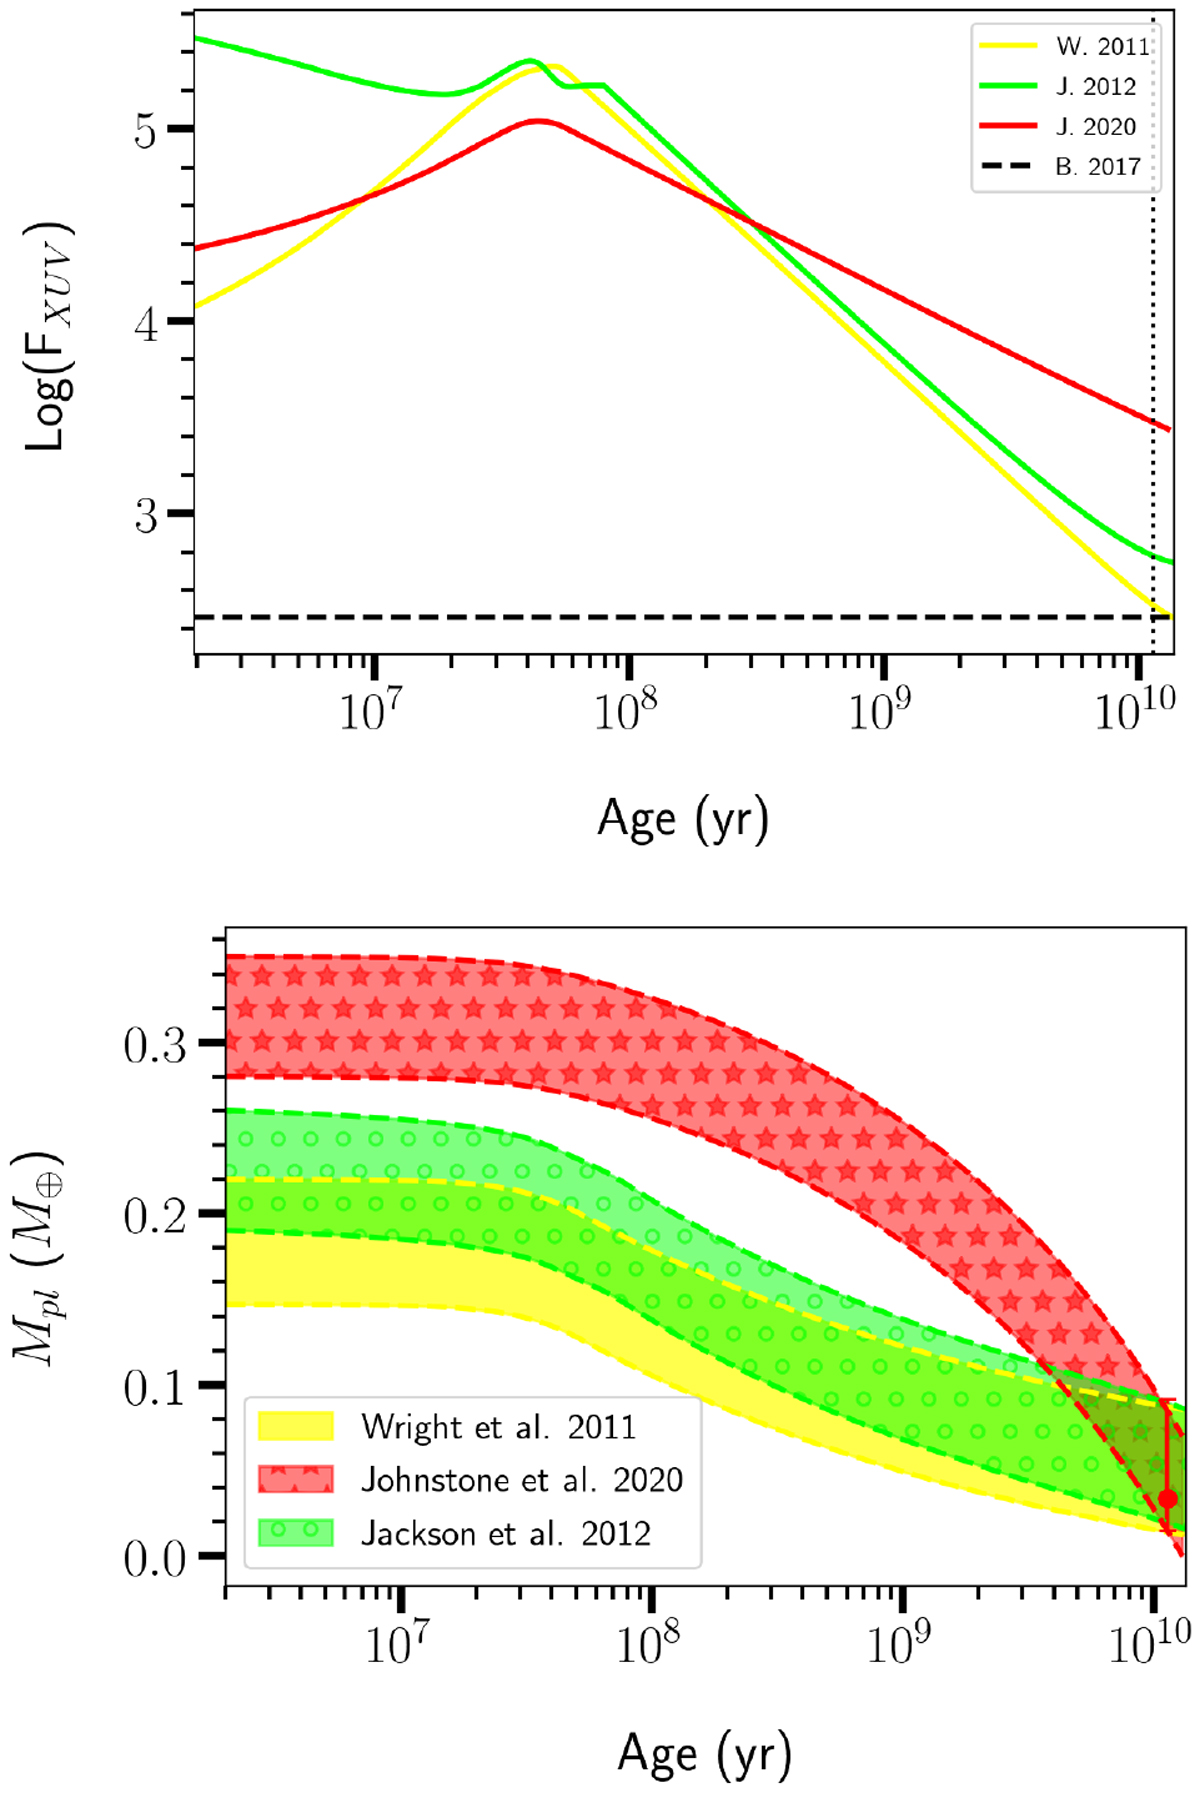
Top panel: comparison among the evolutions of XUV fluxes computed by following the work of Wright et al. (2011; solid yellowline), Jackson et al. (2012; solid green line), and Johnstone et al. (2021; solid red line). The horizontal black-dashed line represents the estimation of the XUV flux of Bourrier et al. (2017). Bottom panel: evolution of the planetary mass computed by considering different XUV-luminosity prescriptions. The colour code corresponds to the one described in the top panel.
Current usage metrics show cumulative count of Article Views (full-text article views including HTML views, PDF and ePub downloads, according to the available data) and Abstracts Views on Vision4Press platform.
Data correspond to usage on the plateform after 2015. The current usage metrics is available 48-96 hours after online publication and is updated daily on week days.
Initial download of the metrics may take a while.