Fig. 9
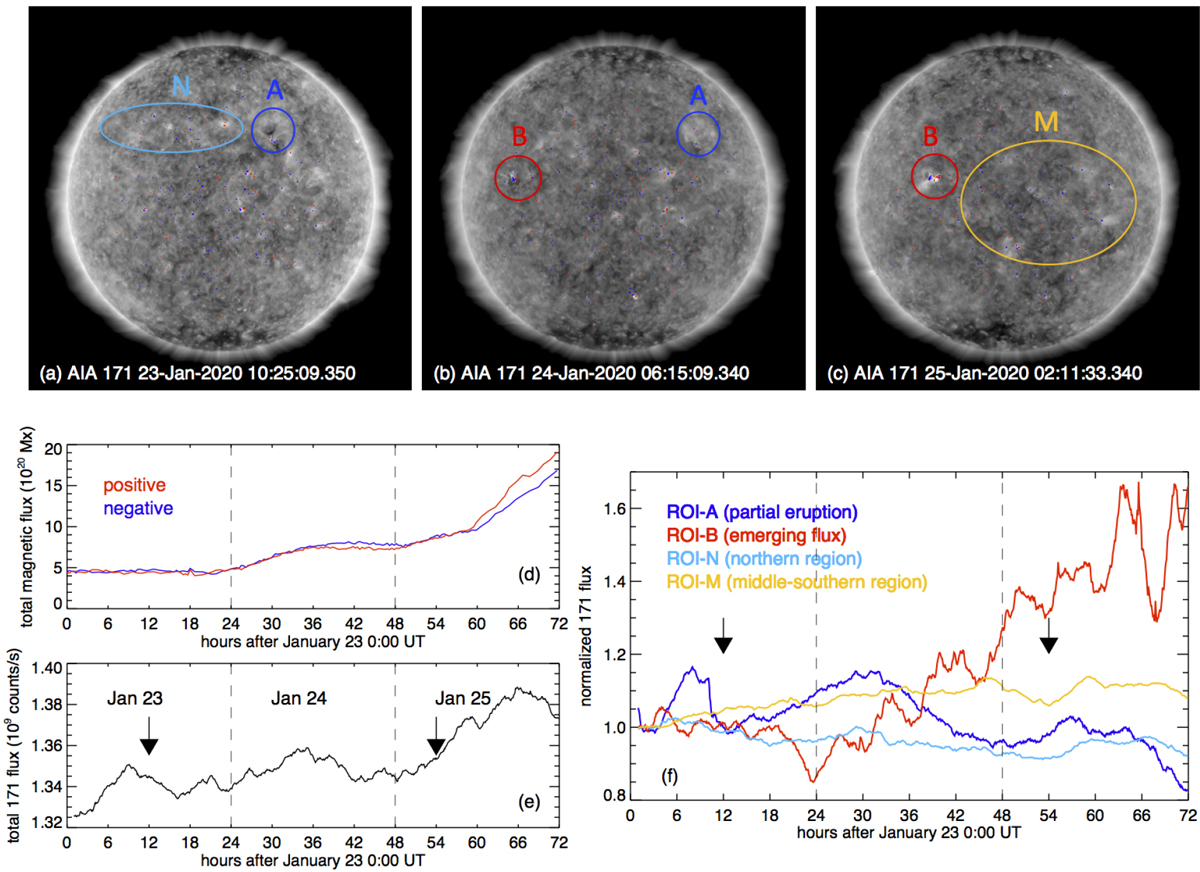
Panels a–c: full disk SDO/AIA images in 171 Å passband on 23, 24 and 25 January, overlaid with contours (± 200 G, red and blue) of line-of-sight magnetic flux density obtained by HMI at around the same times of the AIA images. Panel d: signed total magnetic flux integrated over the full disk. Panel e: total EUV flux in 171 Å integrated over the full disk. Panel f: EUV flux in 171 Å integrated in several Regions Of Interest (ROIs), as indicated by circles or ovals in panels a–c. It is important to note that the EUV flux is derived by integrating data counts in each of these ROIs with a fixed angular extent, and the changing projected area in the plane of sky due to solar rotation is not corrected. For clarity of display, these light curves are normalized to the flux at 0 UT on 23 January. Vertical dashed lines inpanels d–f indicatethe three stages of the radiation and magnetic activities, and the solid arrows indicate the times when the MFR was seen rising on 23 January and then erupted on 25 January, as observed in the STA images. An animation of the AIA/HMI overlays is available online.
Current usage metrics show cumulative count of Article Views (full-text article views including HTML views, PDF and ePub downloads, according to the available data) and Abstracts Views on Vision4Press platform.
Data correspond to usage on the plateform after 2015. The current usage metrics is available 48-96 hours after online publication and is updated daily on week days.
Initial download of the metrics may take a while.