Fig. 5
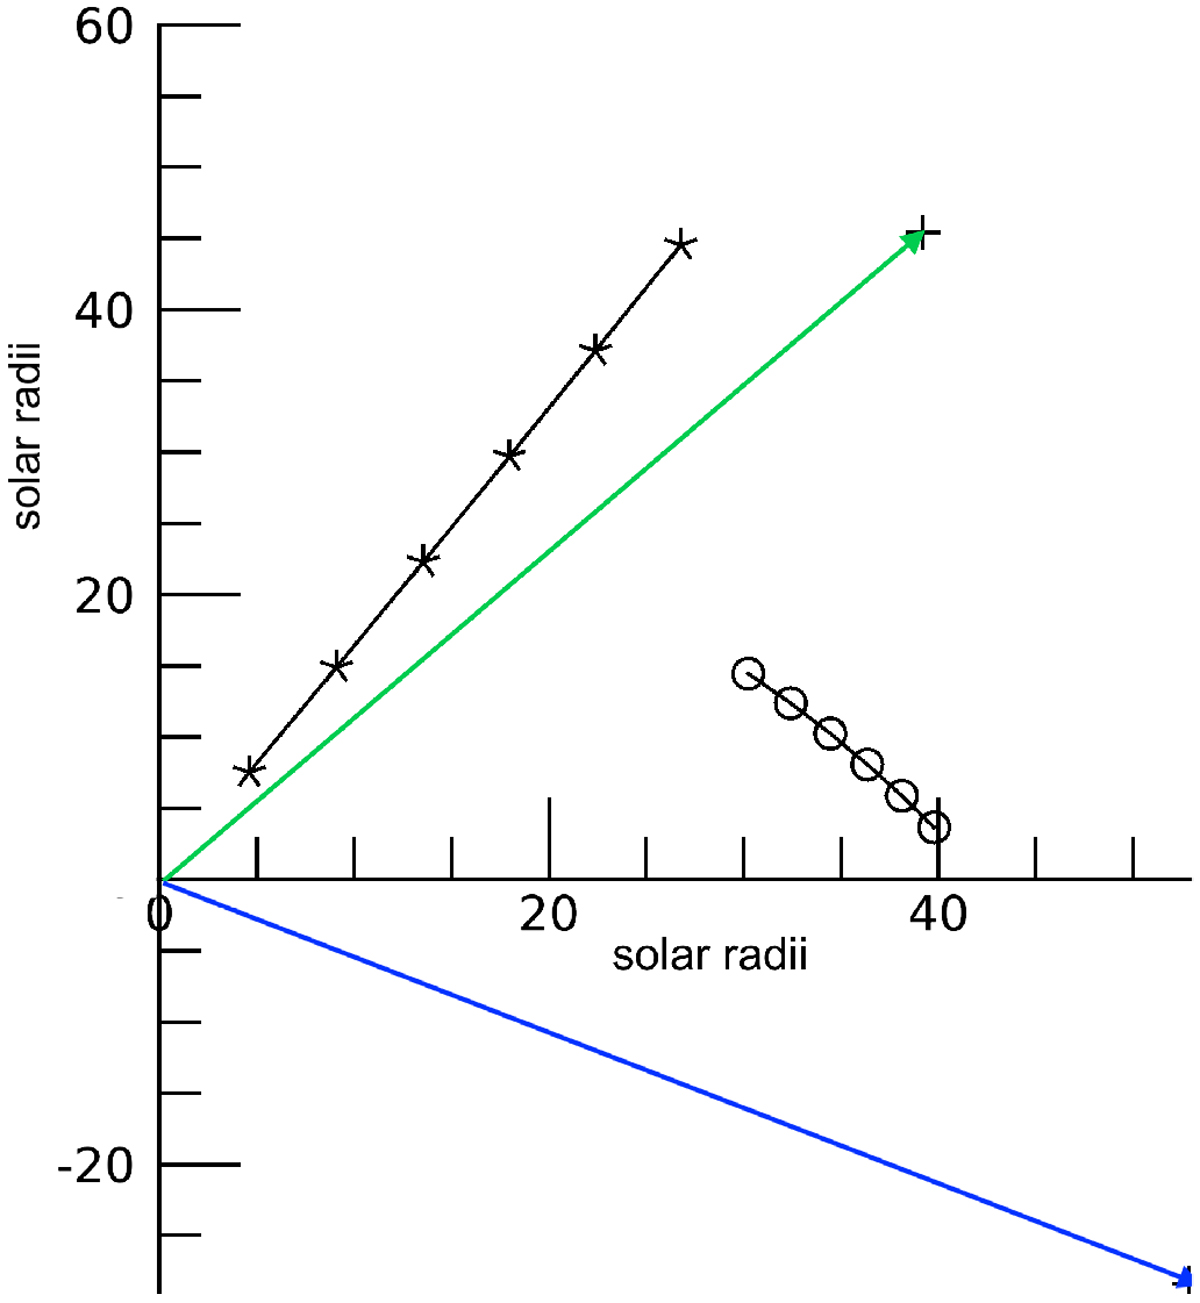
Polar plot showing the locations (HCI longitudes and distances from the Sun in solar radii) at several times for PSP (o) andthe predicted locations of the CME (*) using the trajectory found from the feature tracked in the WISPR-I images. The locations of each are plotted at the same six times: every 6 h from 26 January at 0 UT to 27 January at 6 UT, the approximate time interval that the CME was observed by WISPR. PSP, heading toward perihelion, is approaching the path of the CME. The blue arrow shows the direction to STEREO-A and the green arrow the direction to Earth at the start of the time interval, 26 January at 0 UT.
Current usage metrics show cumulative count of Article Views (full-text article views including HTML views, PDF and ePub downloads, according to the available data) and Abstracts Views on Vision4Press platform.
Data correspond to usage on the plateform after 2015. The current usage metrics is available 48-96 hours after online publication and is updated daily on week days.
Initial download of the metrics may take a while.