Fig. 4
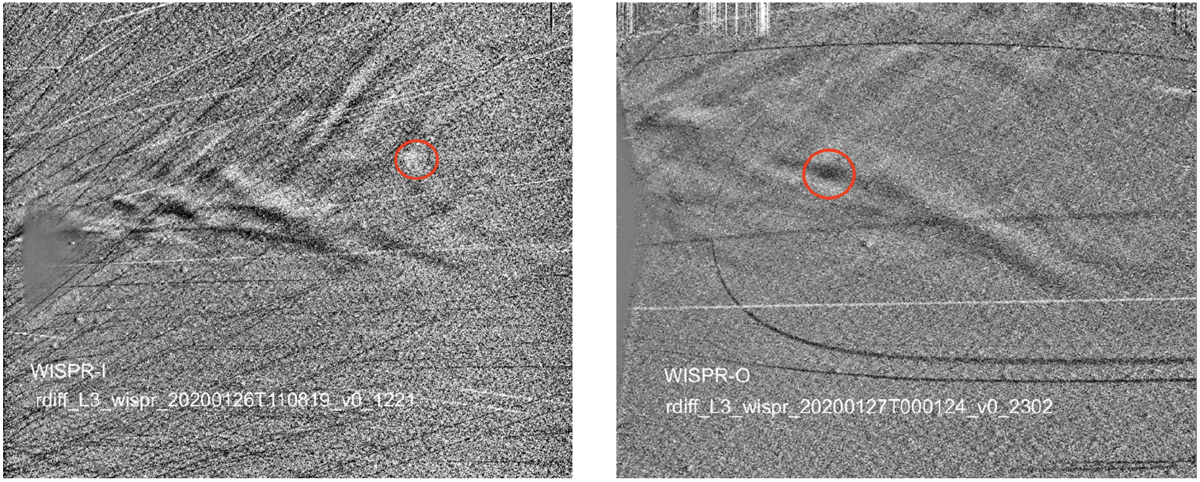
Two distinct features that were tracked in a series of images to determine the trajectory of the CME using the technique of Liewer et al. (2020); both images are Level-3 running-differenced images. Left: WISPR-I image on 26 January 11 UT with the tracked feature (bright V at back of the cavity) circled in red. Right: WISPR-O differenced image on 27 January 0 UT with the feature (dark spot below bright V-shape) circled. The resulting trajectories are summarized in Table 1.
Current usage metrics show cumulative count of Article Views (full-text article views including HTML views, PDF and ePub downloads, according to the available data) and Abstracts Views on Vision4Press platform.
Data correspond to usage on the plateform after 2015. The current usage metrics is available 48-96 hours after online publication and is updated daily on week days.
Initial download of the metrics may take a while.