Fig. 10
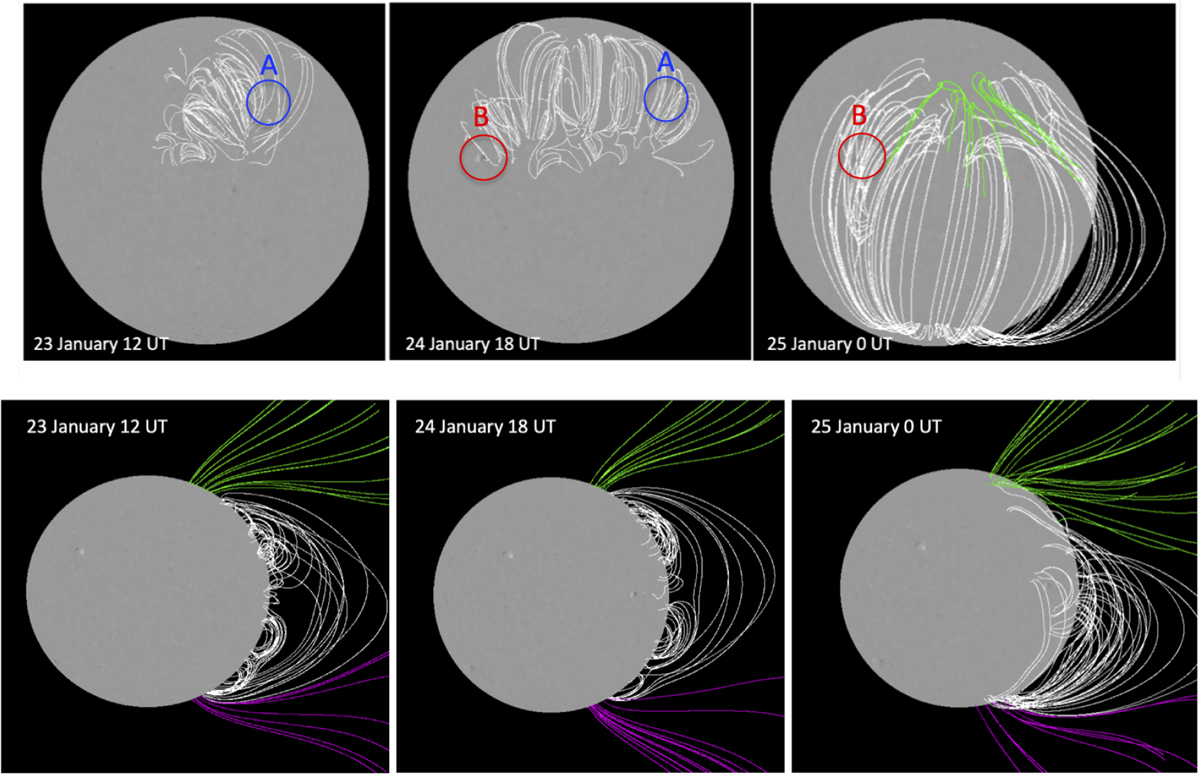
PFSS reconstructions of the coronal magnetic fields at three times showing the evolution of the global magnetic field from the SDO view (top panels) and from the STA view (lower panels). The three times, 23 January at 12 UT, 24 January at 18 UT, and 25 January at 0 UT, show the global magnetic field during the three stages described in the previous text. The green and magnetic lines show the open field lines of two polarities.
Current usage metrics show cumulative count of Article Views (full-text article views including HTML views, PDF and ePub downloads, according to the available data) and Abstracts Views on Vision4Press platform.
Data correspond to usage on the plateform after 2015. The current usage metrics is available 48-96 hours after online publication and is updated daily on week days.
Initial download of the metrics may take a while.