Fig. 1
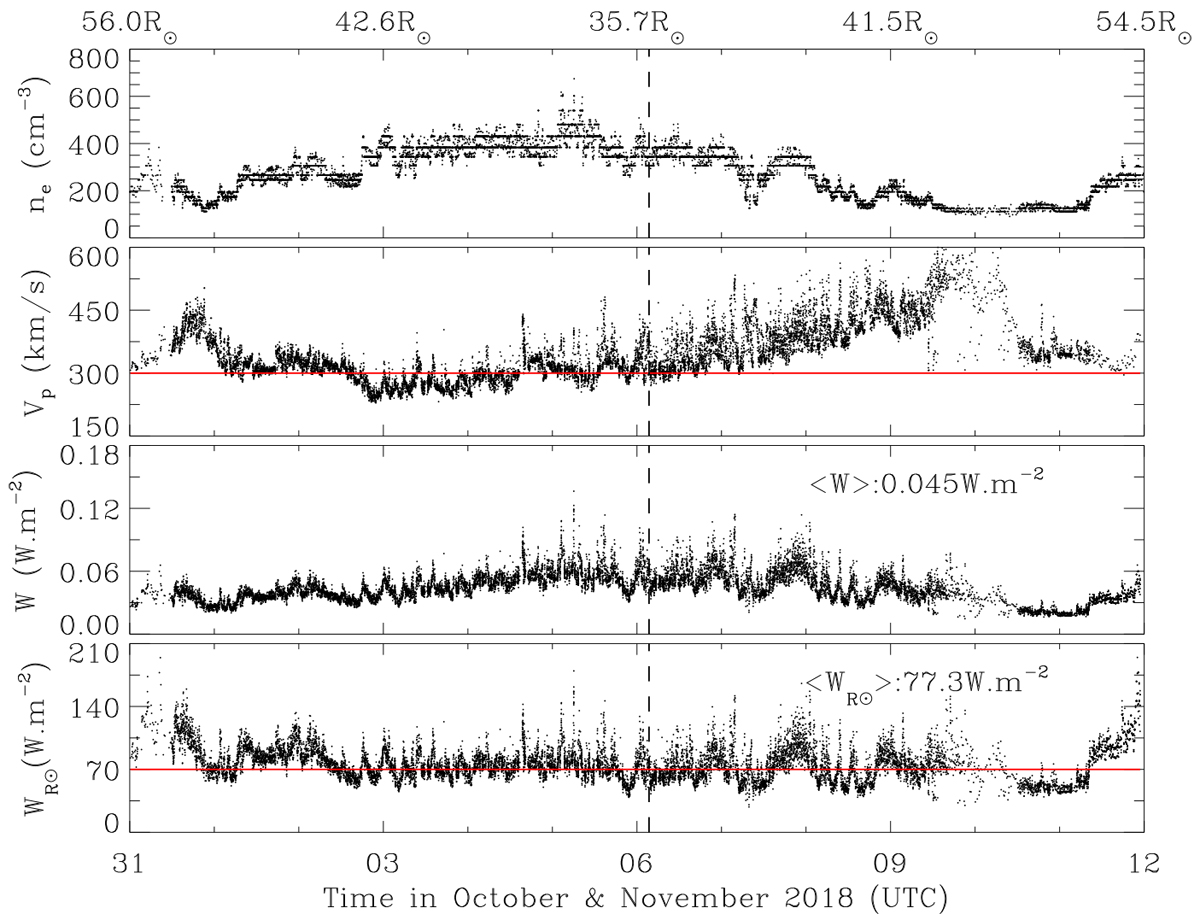
Solar wind density, speed, and energy flux measurements by PSP during Encounter One (from October 31, 2018 00:00:00 to November 12, 2018 00:00:00 UTC). First panel: QTN electron density. Second panel: proton bulk speed. A red horizontal line (Vp = 300 km s−1) is plotted forreference. Third panel: solar wind energy flux W. Fourth panel: solar wind energy flux normalized to one solar radius ![]() (black) with a red horizontal line (
(black) with a red horizontal line (![]() W m−2) superimposed for reference. The heliocentric distance (in units of the Solar radius
R⊙) is indicated at the top of the first panel and the black vertical line denotes the perihelion of the PSP orbit.
W m−2) superimposed for reference. The heliocentric distance (in units of the Solar radius
R⊙) is indicated at the top of the first panel and the black vertical line denotes the perihelion of the PSP orbit.
Current usage metrics show cumulative count of Article Views (full-text article views including HTML views, PDF and ePub downloads, according to the available data) and Abstracts Views on Vision4Press platform.
Data correspond to usage on the plateform after 2015. The current usage metrics is available 48-96 hours after online publication and is updated daily on week days.
Initial download of the metrics may take a while.