Fig. 7
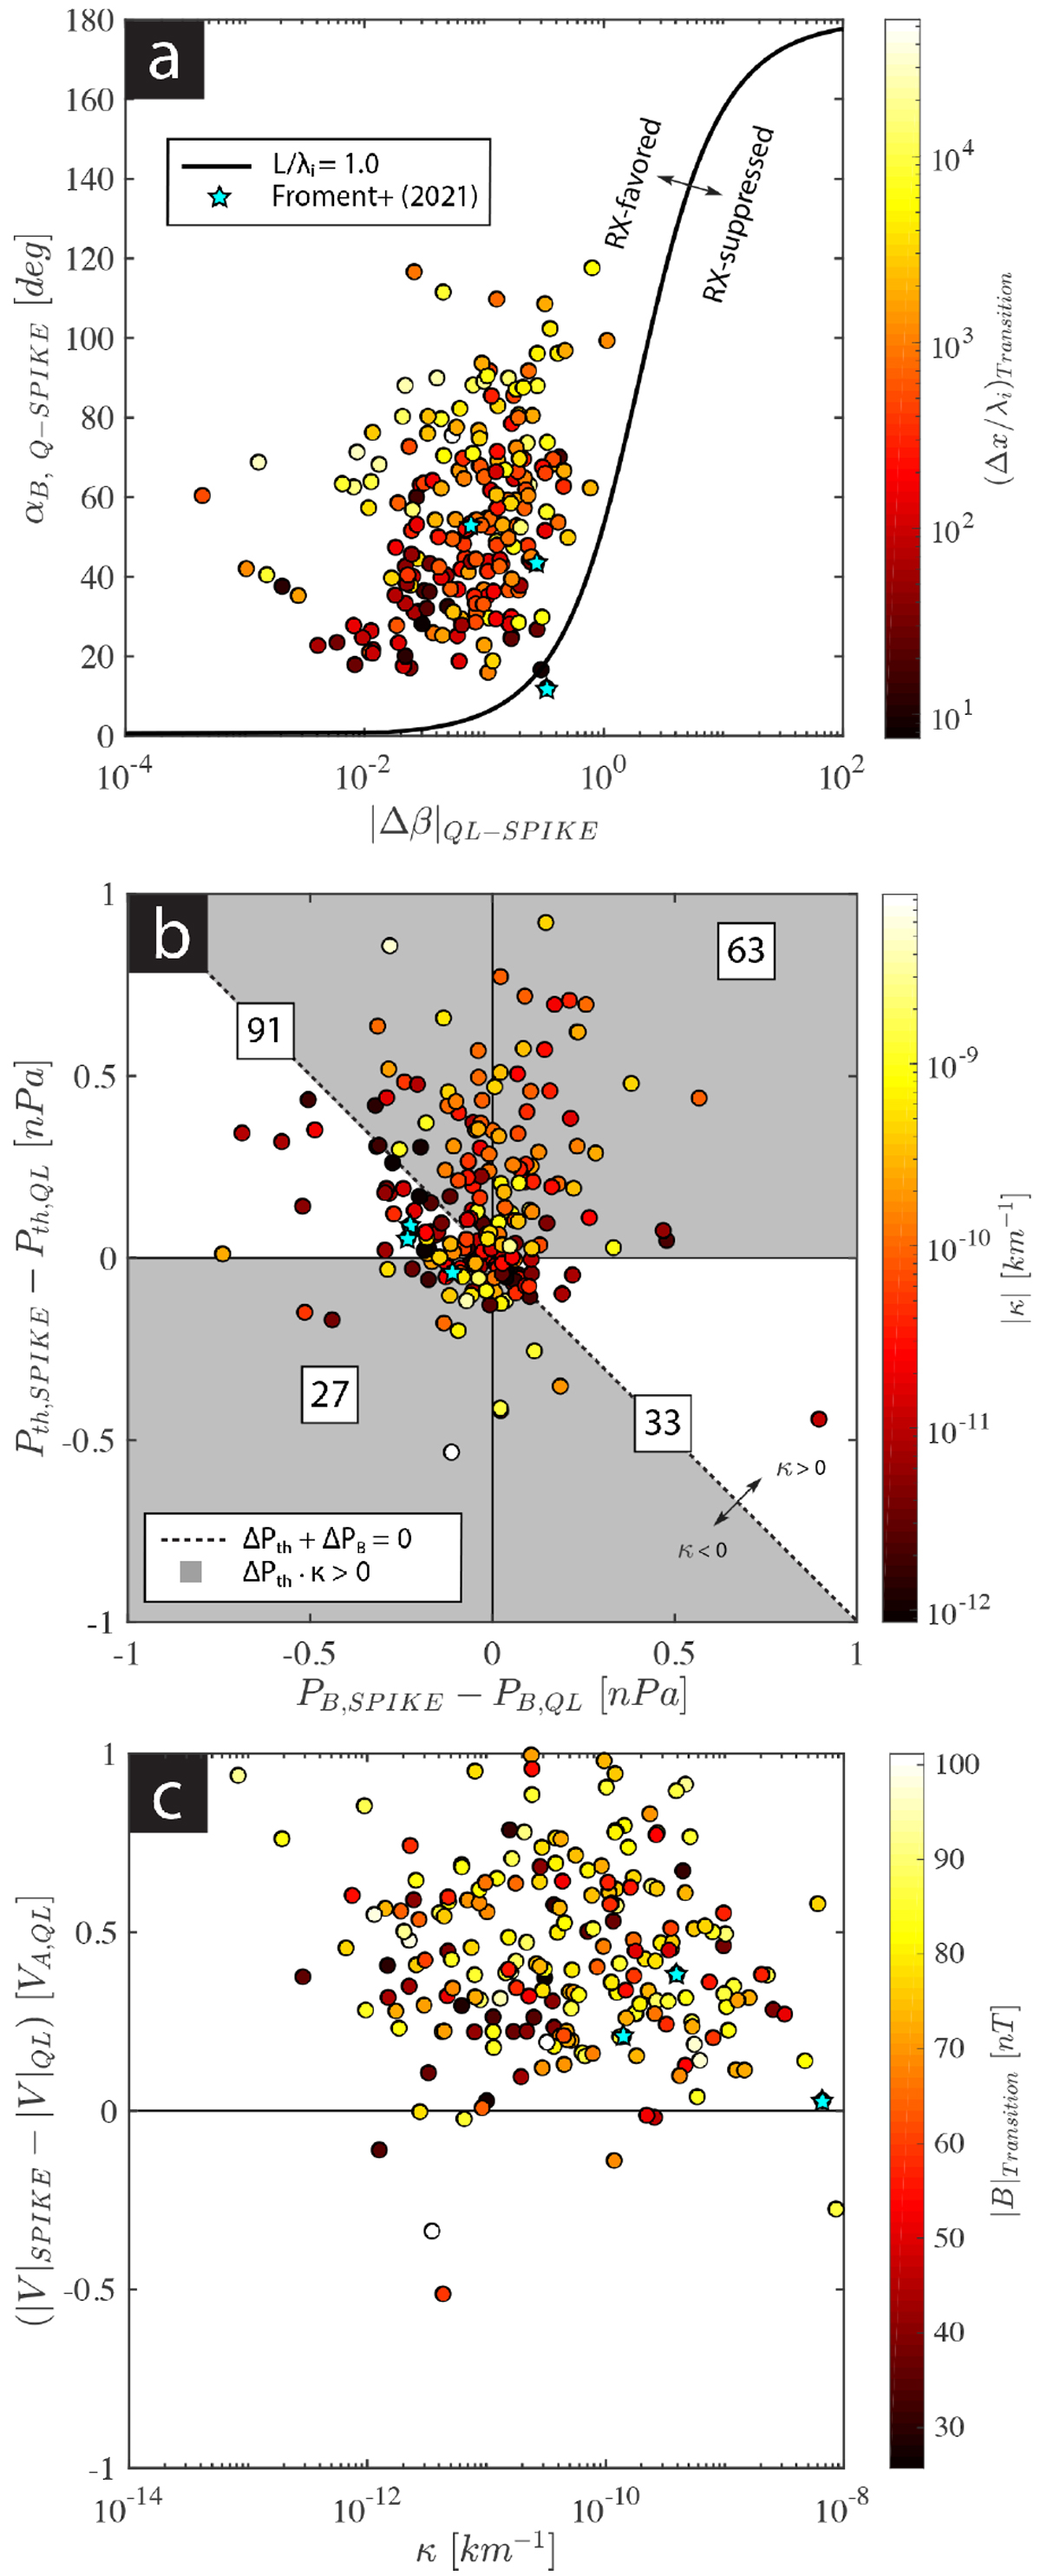
Scatter plots of parameters at the 214 leading RD-type switchback transition regions: (a) Plasma beta variations and magnetic shear angles. The solid curve shows |Δβ| = 2(L∕λi) tan(α∕2) for (L∕λi) = 1.0. The shading indicates the switchback transition region’s normalized thickness Δx∕λi. The cyan stars correspond to the reconnecting leading switchback transition regions reported by Froment et al. (2021). (b) Variations in thermal and magnetic pressures. The values in each box determine the number of the RD-type transition regions in each quadrant. The color shading indicates
![]() . The gray shaded regions show where κ ⋅ ΔPth > 0 (bad curvature). The dashed line represents the curve along which ΔPth + ΔPB = 0 (referred to as the total-pressure balance). (c) κ
and the normalized proton speed variations. The shading indicates the average magnetic field magnitude inside the leading transition regions, |B|Transition.
. The gray shaded regions show where κ ⋅ ΔPth > 0 (bad curvature). The dashed line represents the curve along which ΔPth + ΔPB = 0 (referred to as the total-pressure balance). (c) κ
and the normalized proton speed variations. The shading indicates the average magnetic field magnitude inside the leading transition regions, |B|Transition.
Current usage metrics show cumulative count of Article Views (full-text article views including HTML views, PDF and ePub downloads, according to the available data) and Abstracts Views on Vision4Press platform.
Data correspond to usage on the plateform after 2015. The current usage metrics is available 48-96 hours after online publication and is updated daily on week days.
Initial download of the metrics may take a while.