Fig. 5
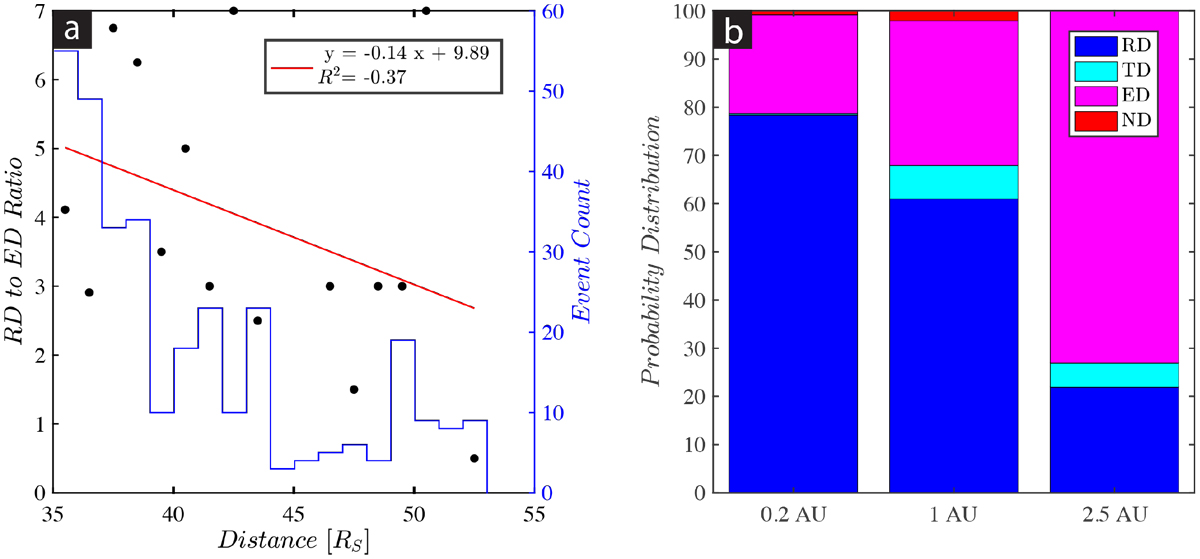
(a) Scatter plot of the ratio of number of RD events to that of ED as a function of distance from the Sun. The histogram of event count per radial distance (bin width = 1 [RS ]) is provided on the right y-axis in blue for reference. (b) Stacked bar plots of the relative ratios of RD:TD:ED:ND discontinuities for the present study (PSP@0.2 AU) and the studies by Neugebauer et al. (1984, ISEE@1.0 AU) and Yamauchi et al. (2002, This email address is being protected from spambots. You need JavaScript enabled to view it. –3.73 AU).
Current usage metrics show cumulative count of Article Views (full-text article views including HTML views, PDF and ePub downloads, according to the available data) and Abstracts Views on Vision4Press platform.
Data correspond to usage on the plateform after 2015. The current usage metrics is available 48-96 hours after online publication and is updated daily on week days.
Initial download of the metrics may take a while.