Fig. 7
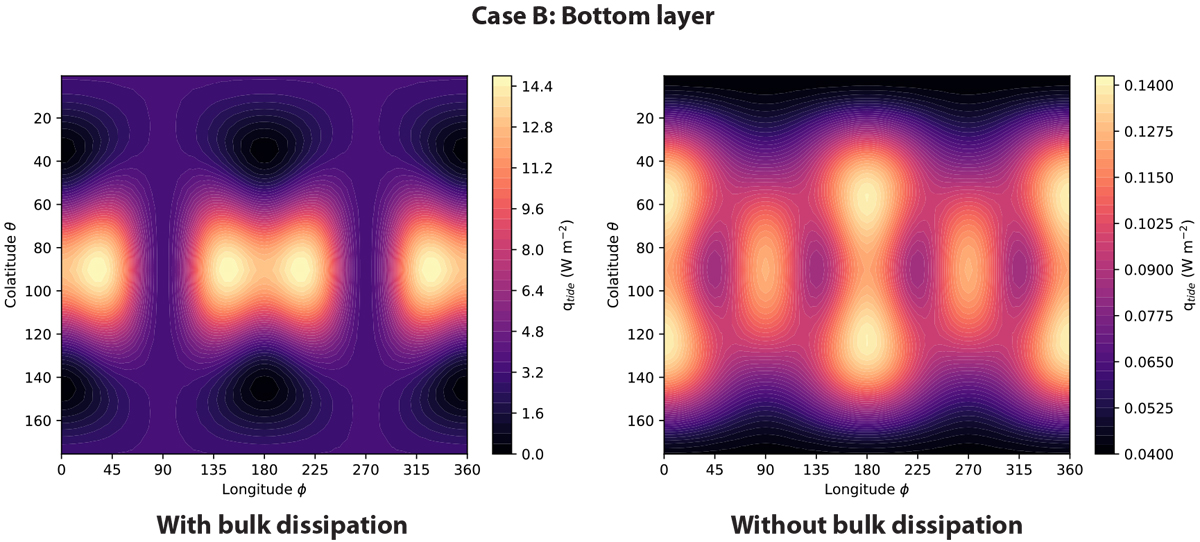
Patterns of tidal heat flux qtide integratedover the bottom partially molten layer for one orbit cycle at a given location for the reference model denoted by a red star in Fig. 3, Case B, corresponding to ϕ = 0.3106. Left: values obtained when bulk dissipation is accounted for (providing a total power Pbulk = 100 TW). Right:values obtained when bulk dissipation is not accounted for; in this case the total power is less than 100 TW (12 TW). The two color scales are not the same.
Current usage metrics show cumulative count of Article Views (full-text article views including HTML views, PDF and ePub downloads, according to the available data) and Abstracts Views on Vision4Press platform.
Data correspond to usage on the plateform after 2015. The current usage metrics is available 48-96 hours after online publication and is updated daily on week days.
Initial download of the metrics may take a while.