Open Access
Fig. 5
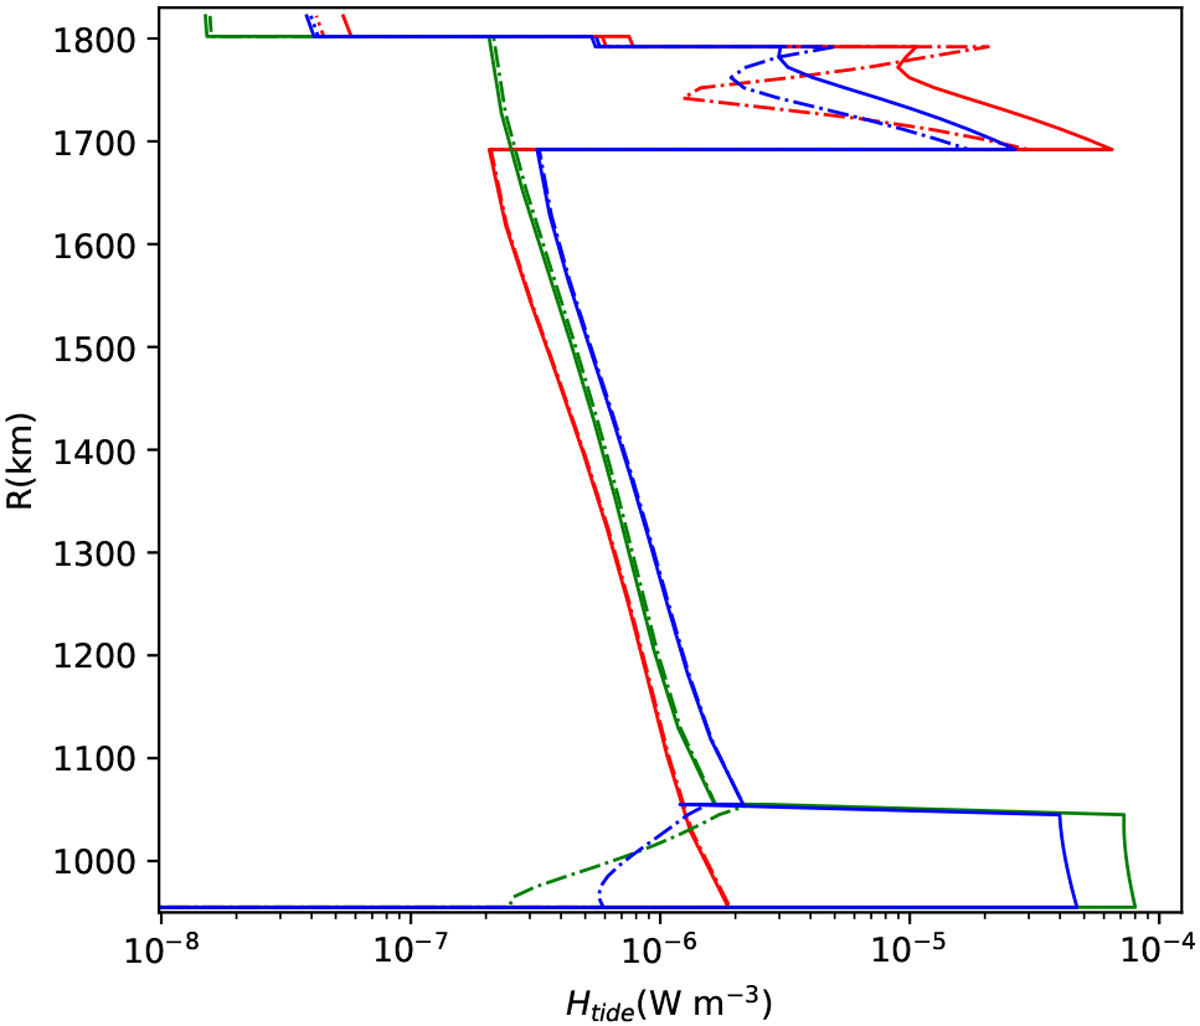
Radial distribution of the tidal dissipation rate ![]() within Io’s interior. These profiles correspond to the reference cases denoted by red stars in Fig. 3, i.e., they correspond to a thickness dmelt = 100 km, and they all produce Pbulk = 100 TW for the cases including bulk dissipation. The legend is the same as in Fig. 4.
within Io’s interior. These profiles correspond to the reference cases denoted by red stars in Fig. 3, i.e., they correspond to a thickness dmelt = 100 km, and they all produce Pbulk = 100 TW for the cases including bulk dissipation. The legend is the same as in Fig. 4.
Current usage metrics show cumulative count of Article Views (full-text article views including HTML views, PDF and ePub downloads, according to the available data) and Abstracts Views on Vision4Press platform.
Data correspond to usage on the plateform after 2015. The current usage metrics is available 48-96 hours after online publication and is updated daily on week days.
Initial download of the metrics may take a while.