Fig. 3
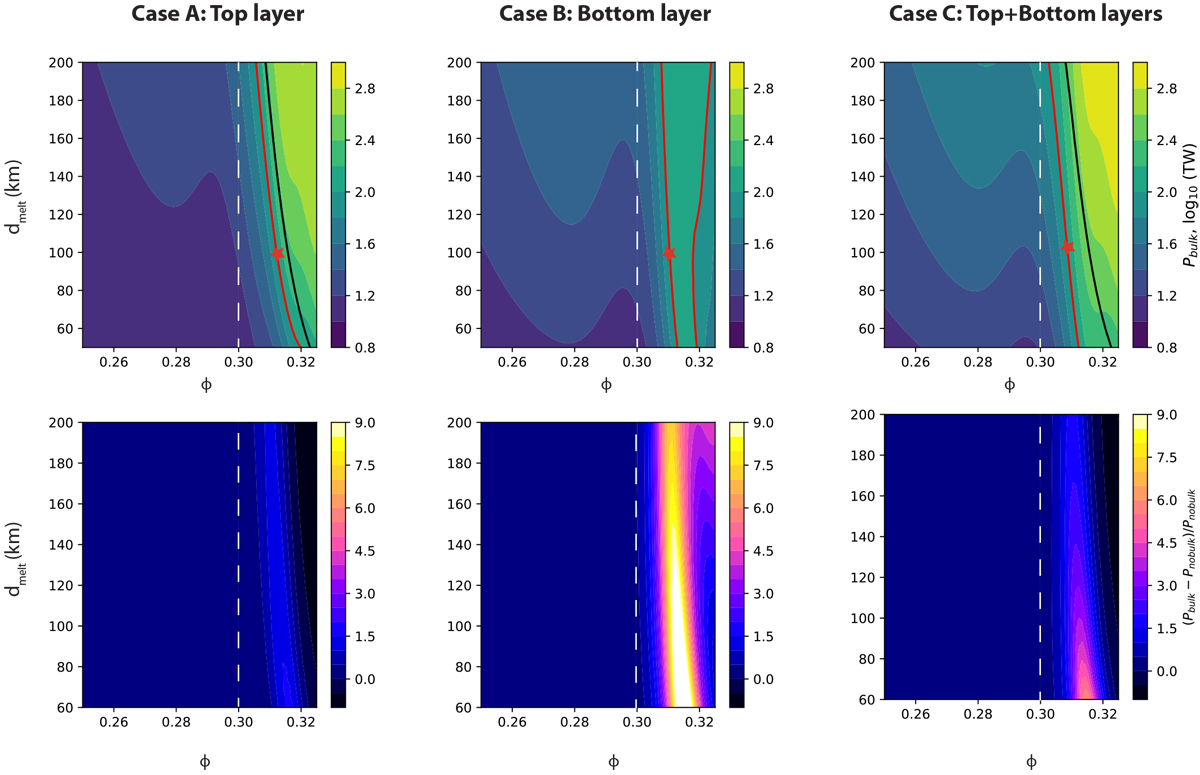
Io’s tidal heat budget as a function of melt fraction ϕ and the thickness dmelt of the partially molten layer(s). Three configurations are considered for the internal structure (see Fig. 1): with one partially molten layer at the top (case A, left column) or at the bottom of the mantle (case B, middle column), or with partially molten layers both at the top and bottom of the mantle (case C, right column). The color scale refers to the global tidal power Pbulk, including the contribution of bulk dissipation (top panel), and to the ratio (Pbulk − Pnobulk)∕Pnobulk, with Pnobulk designating the reference global tidal power produced with shear dissipation only (bottom panel). The red curves highlight the 100 TW value. The black curve indicates the parameters required to obtain this same value without bulk dissipation. For each configuration the red star denotes a reference case corresponding to a thickness dmelt = 100 km. The white dashed line indicates the value of ϕc.
Current usage metrics show cumulative count of Article Views (full-text article views including HTML views, PDF and ePub downloads, according to the available data) and Abstracts Views on Vision4Press platform.
Data correspond to usage on the plateform after 2015. The current usage metrics is available 48-96 hours after online publication and is updated daily on week days.
Initial download of the metrics may take a while.