Fig. 5
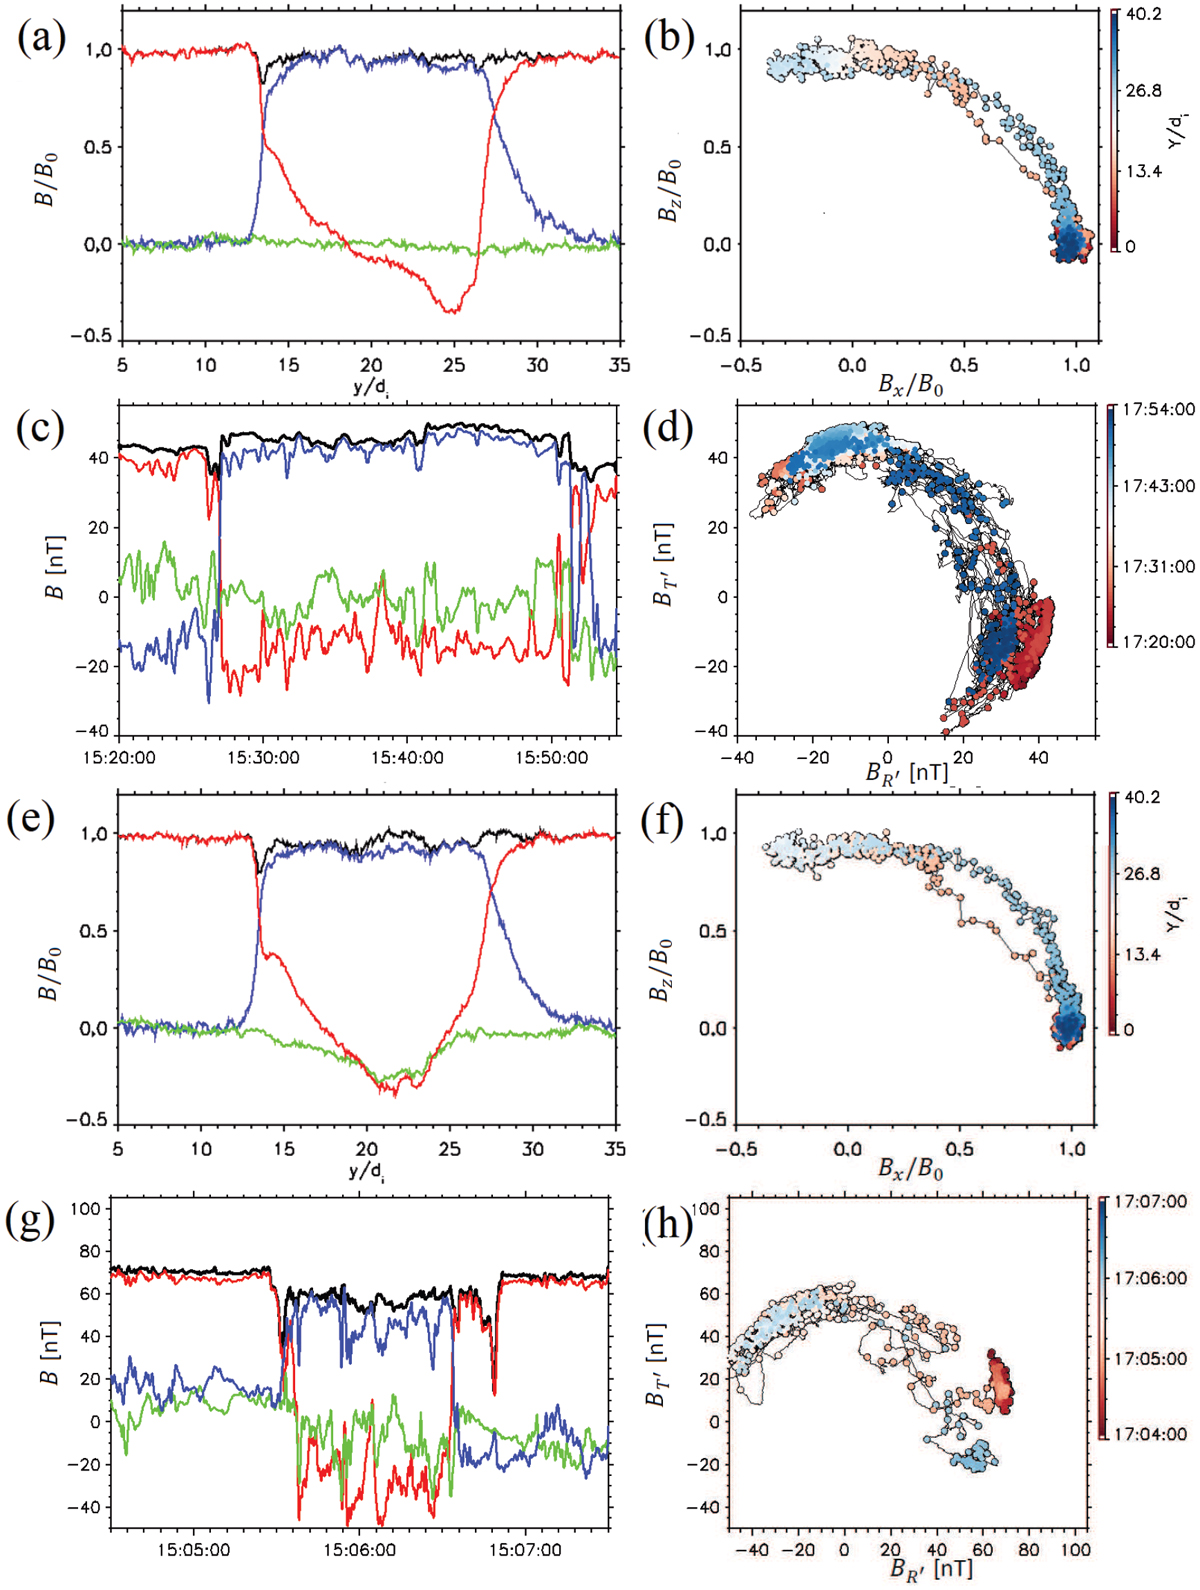
(a) and (e): cuts of the magnetic fields (Bx in red, By in green, Bz in blue and B in black) and associated hodograms in (b) and (f) across the large flux rope in Fig. 4. The cuts are along the white lines in (c). The cut in (a) corresponds to the midplane of the island where By sim 0 while that in(e) is offset fromthe centerline where By < 0. In (c) and (g) time profiles of magnetic fields (![]() in red,
in red, ![]() in green,
in green, ![]() in blue and B
in black) and in (d) and (h) associated hodograms from switchbacks from PSP/FIELDS. The two events correspond to cases with the minimum variance magnetic field
in blue and B
in black) and in (d) and (h) associated hodograms from switchbacks from PSP/FIELDS. The two events correspond to cases with the minimum variance magnetic field ![]() small (Nov. 1, 2018) (as in (a)) and negative(Nov. 4, 2018) (as in (e)). See the text for a discussion of the coordinate system used to present the spacecraft data. It differs from the traditional
R,
T,
N
system.
small (Nov. 1, 2018) (as in (a)) and negative(Nov. 4, 2018) (as in (e)). See the text for a discussion of the coordinate system used to present the spacecraft data. It differs from the traditional
R,
T,
N
system.
Current usage metrics show cumulative count of Article Views (full-text article views including HTML views, PDF and ePub downloads, according to the available data) and Abstracts Views on Vision4Press platform.
Data correspond to usage on the plateform after 2015. The current usage metrics is available 48-96 hours after online publication and is updated daily on week days.
Initial download of the metrics may take a while.