Fig. 2

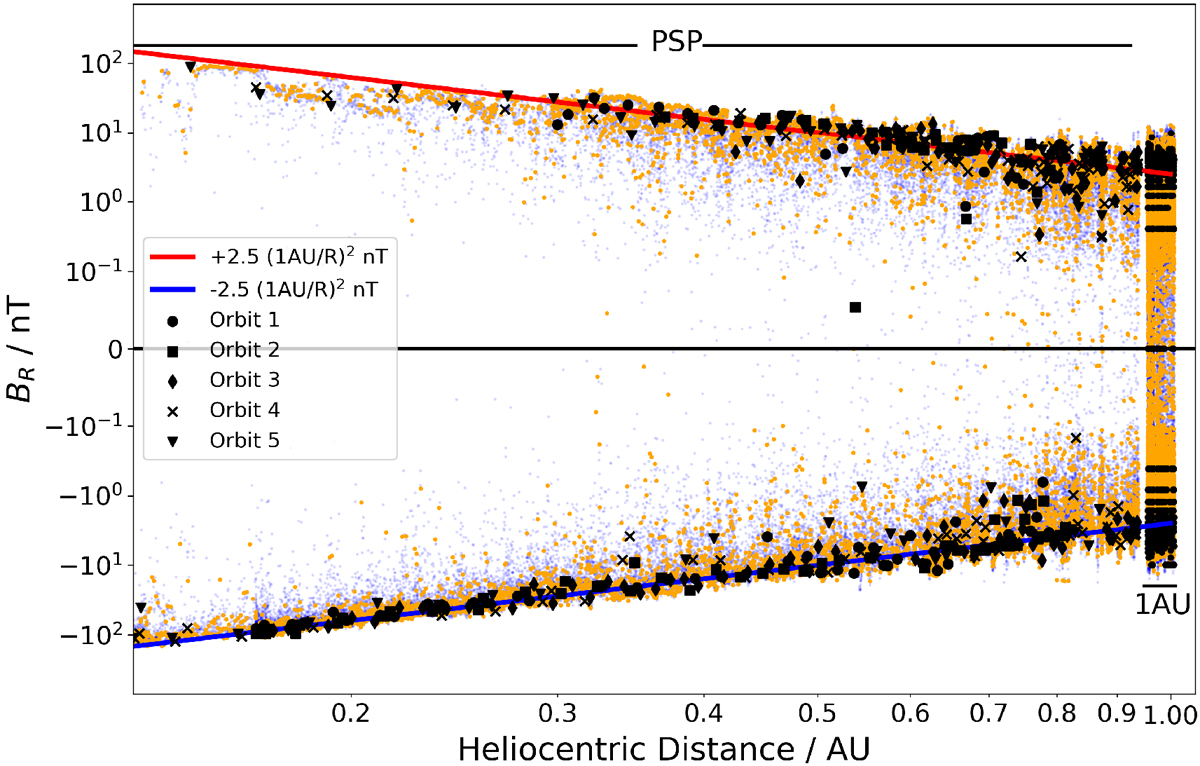
Radial scaling of BR. All the data from Fig. 1 is re-plotted against radius on a symmetric log–log scale. Data with |BR | < 0.1 nT is plotted on a linear scale, which accounts for the block of data passing through zero near 1 AU. One-minute averages are plotted in faint magenta. One-hour modes are shown in orange. One-day modes are shown in black with different symbols differentiating the subsequent orbits. We note thatorbits 4 and 5 (crosses and triangles) extend to lower radii than orbits 1–3. A 2.5 nT (1 AU/R)2 trend line isplotted for positive (red) and negative (blue) polarities. A small data gap shows the narrow gap in radial coverage between PSP’s aphelia and STEREO A’s perihelia.
Current usage metrics show cumulative count of Article Views (full-text article views including HTML views, PDF and ePub downloads, according to the available data) and Abstracts Views on Vision4Press platform.
Data correspond to usage on the plateform after 2015. The current usage metrics is available 48-96 hours after online publication and is updated daily on week days.
Initial download of the metrics may take a while.


