Open Access
Fig. 3
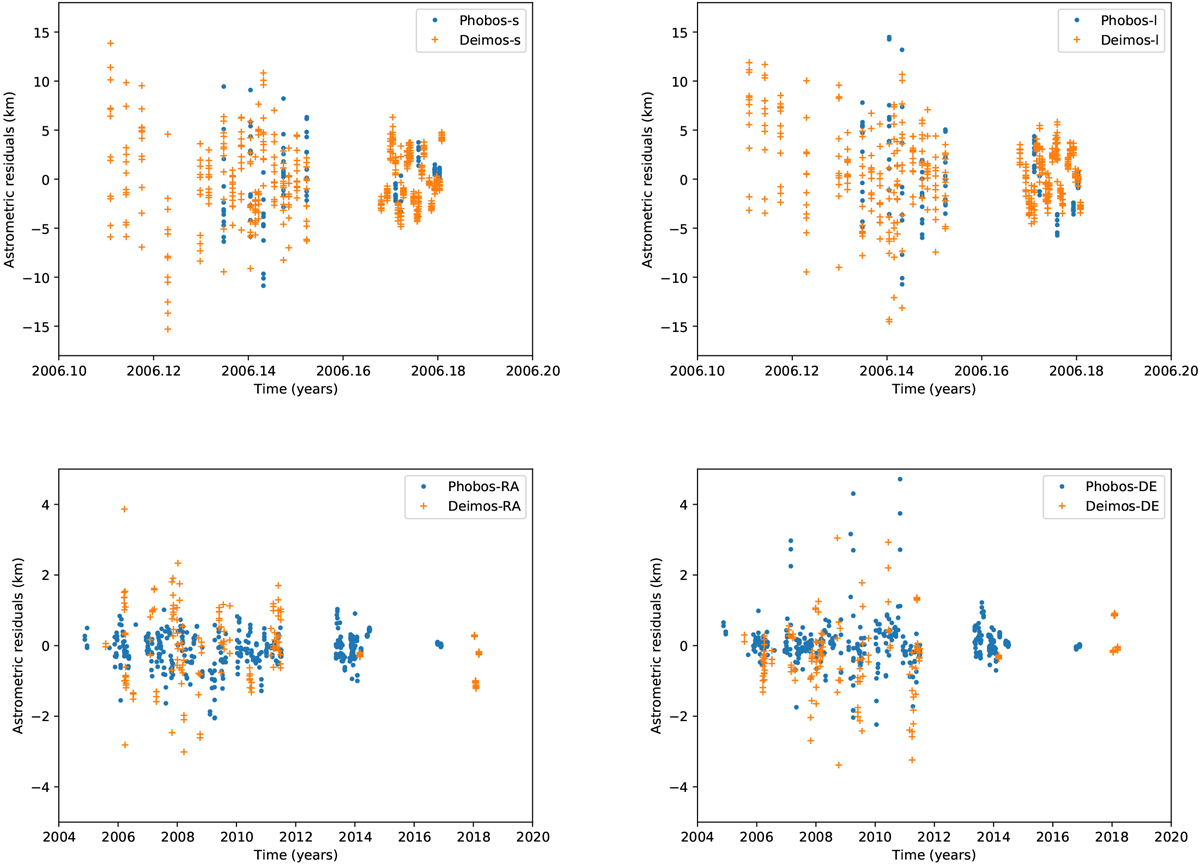
Differences in distance after the fit between the model and (i) the MRO data (top), and (ii) the MEX data (bottom). The initial positions and velocities of the satellites, the Martian dissipation quality factor Q, and the forced libration amplitude of Phobos were fit here.
Current usage metrics show cumulative count of Article Views (full-text article views including HTML views, PDF and ePub downloads, according to the available data) and Abstracts Views on Vision4Press platform.
Data correspond to usage on the plateform after 2015. The current usage metrics is available 48-96 hours after online publication and is updated daily on week days.
Initial download of the metrics may take a while.