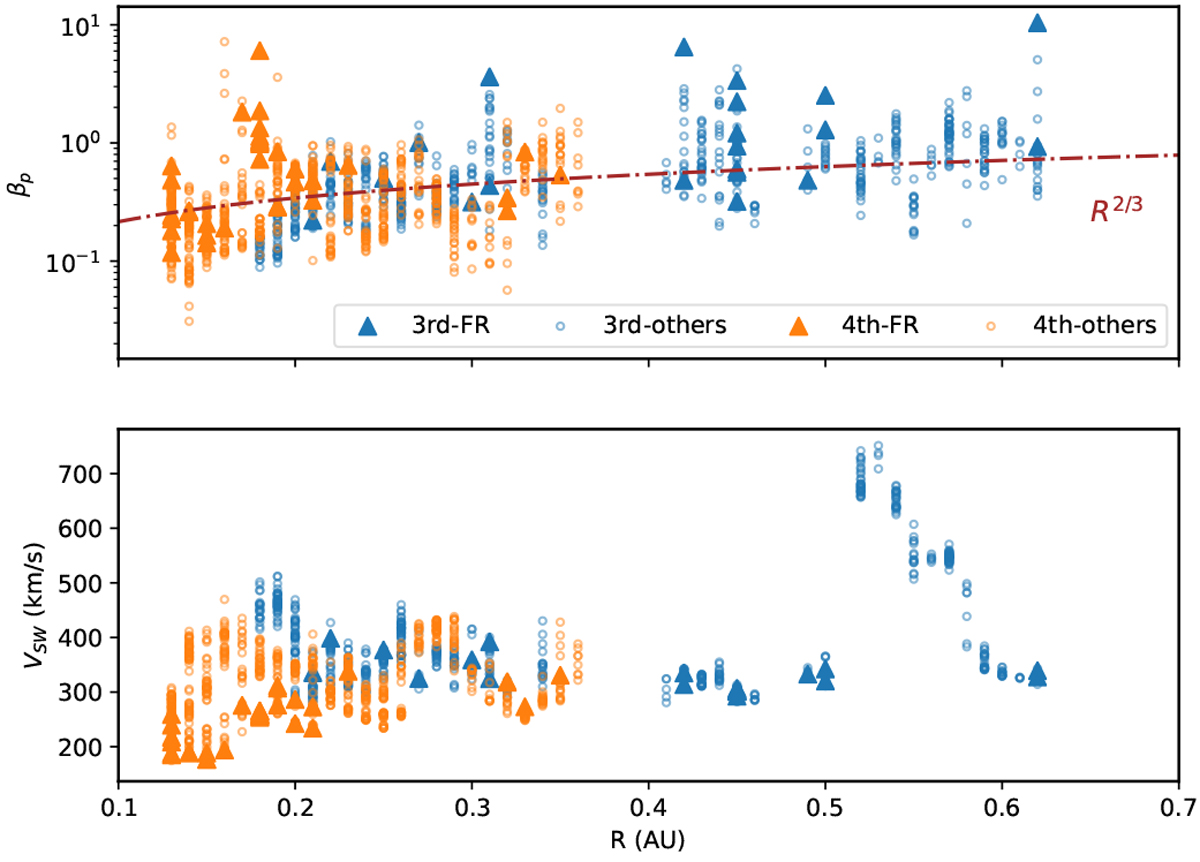
Fig. 9

Radial dependence of the proton plasma beta (top panel) and solar wind speed (bottom panel) of the identified high magnetic helicity structures in the third orbit (blue markers) and fourth orbit of PSP (orange markers). Magnetic flux ropes are plotted as triangles and other high magnetic helicity structures are plotted as circles. The red dashed-dotted curve in the top panel represents the adiabatic prediction of the plasma beta in the solar wind with β ∝ R2∕3.
Current usage metrics show cumulative count of Article Views (full-text article views including HTML views, PDF and ePub downloads, according to the available data) and Abstracts Views on Vision4Press platform.
Data correspond to usage on the plateform after 2015. The current usage metrics is available 48-96 hours after online publication and is updated daily on week days.
Initial download of the metrics may take a while.


